
Remote control, data acquisition, visualization, and analysis
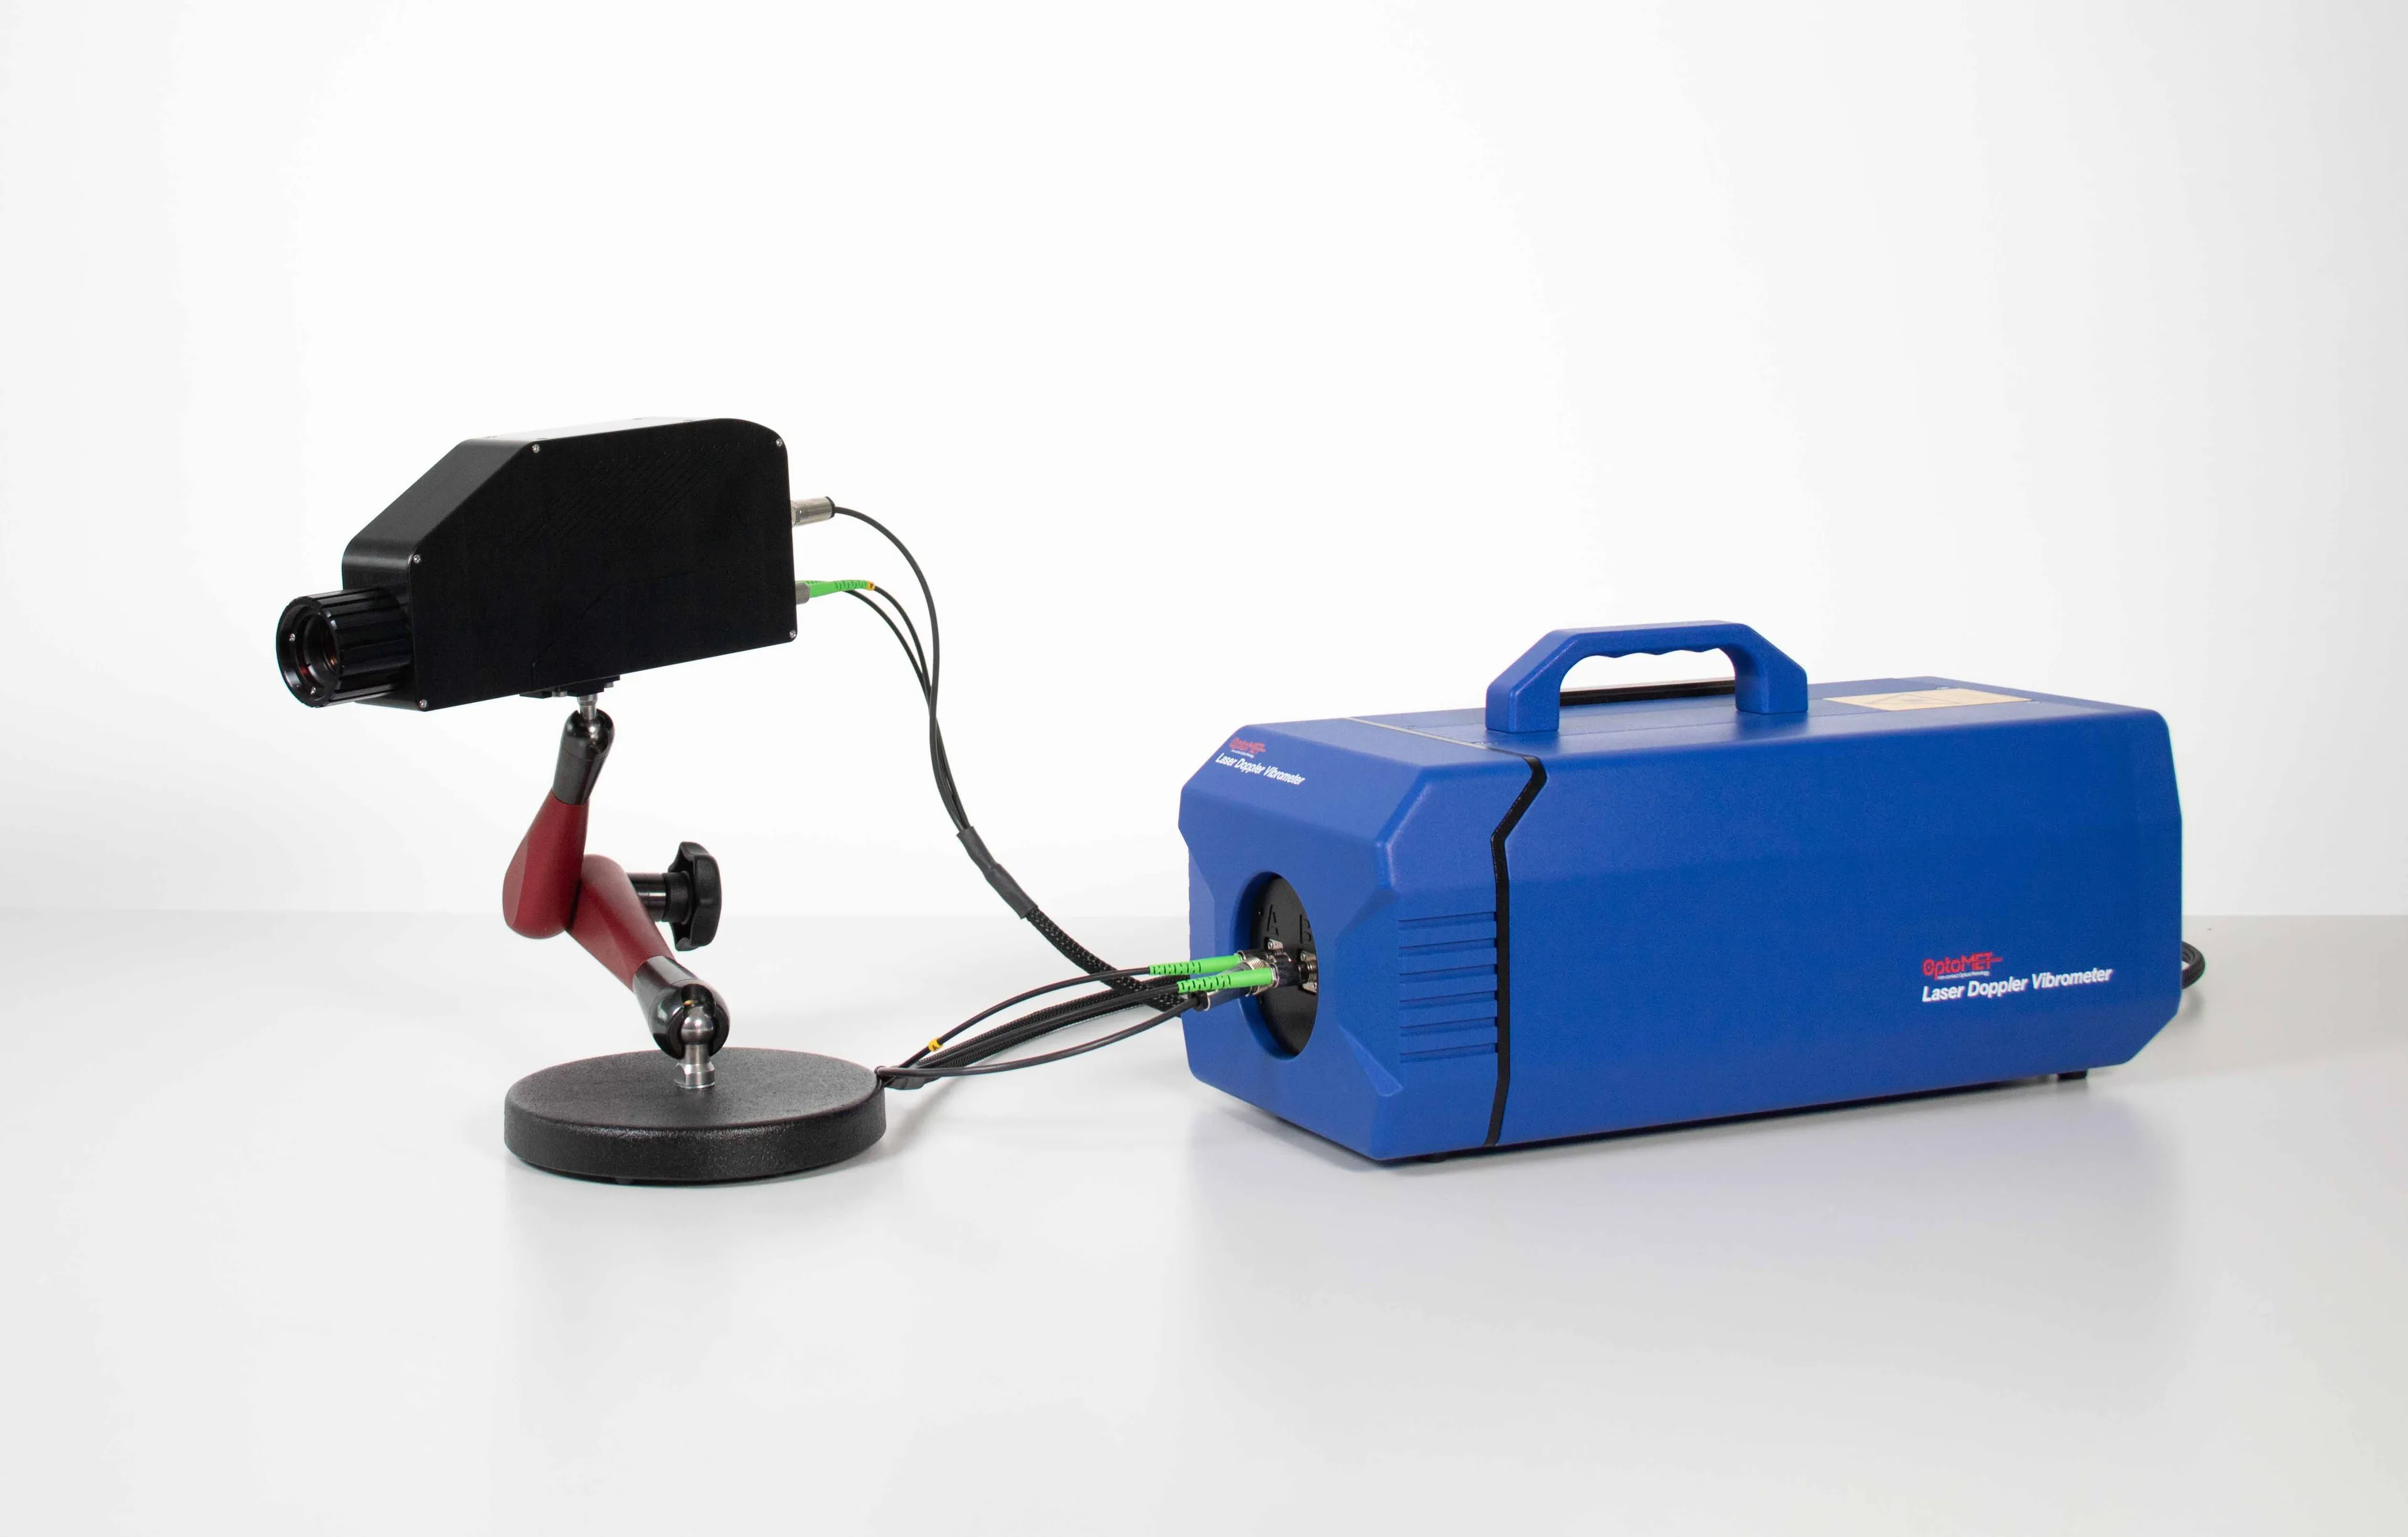
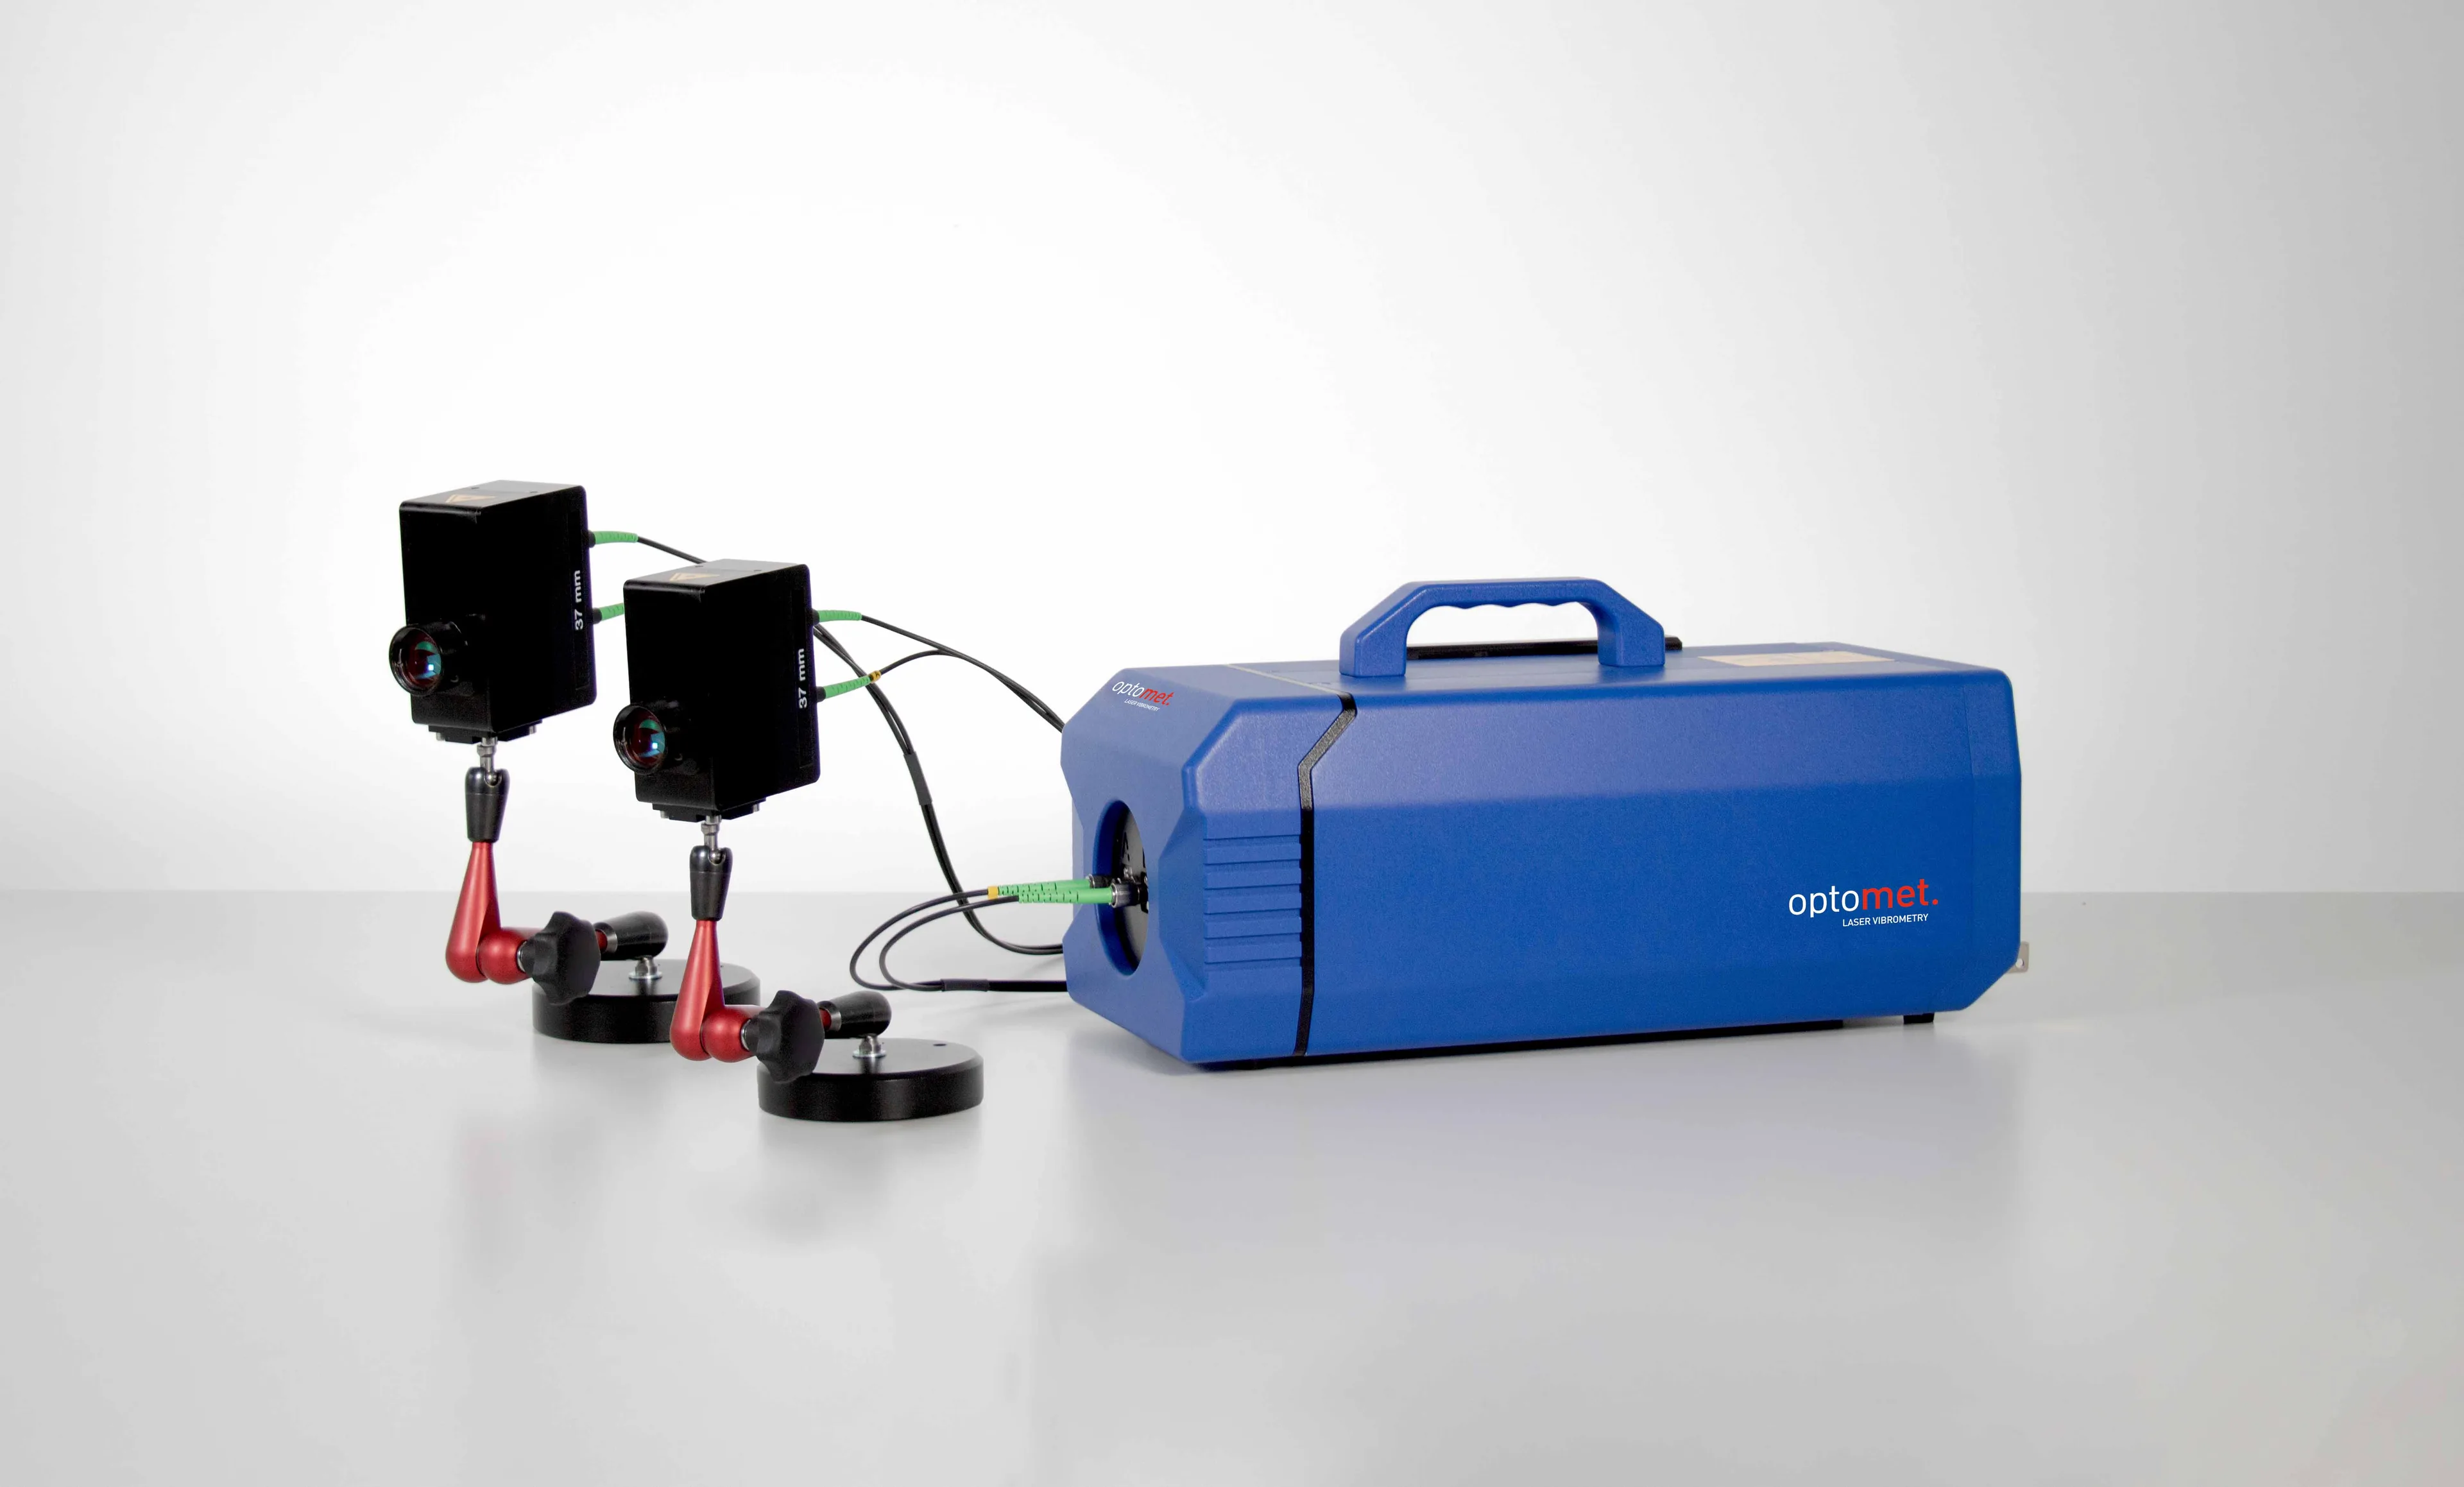
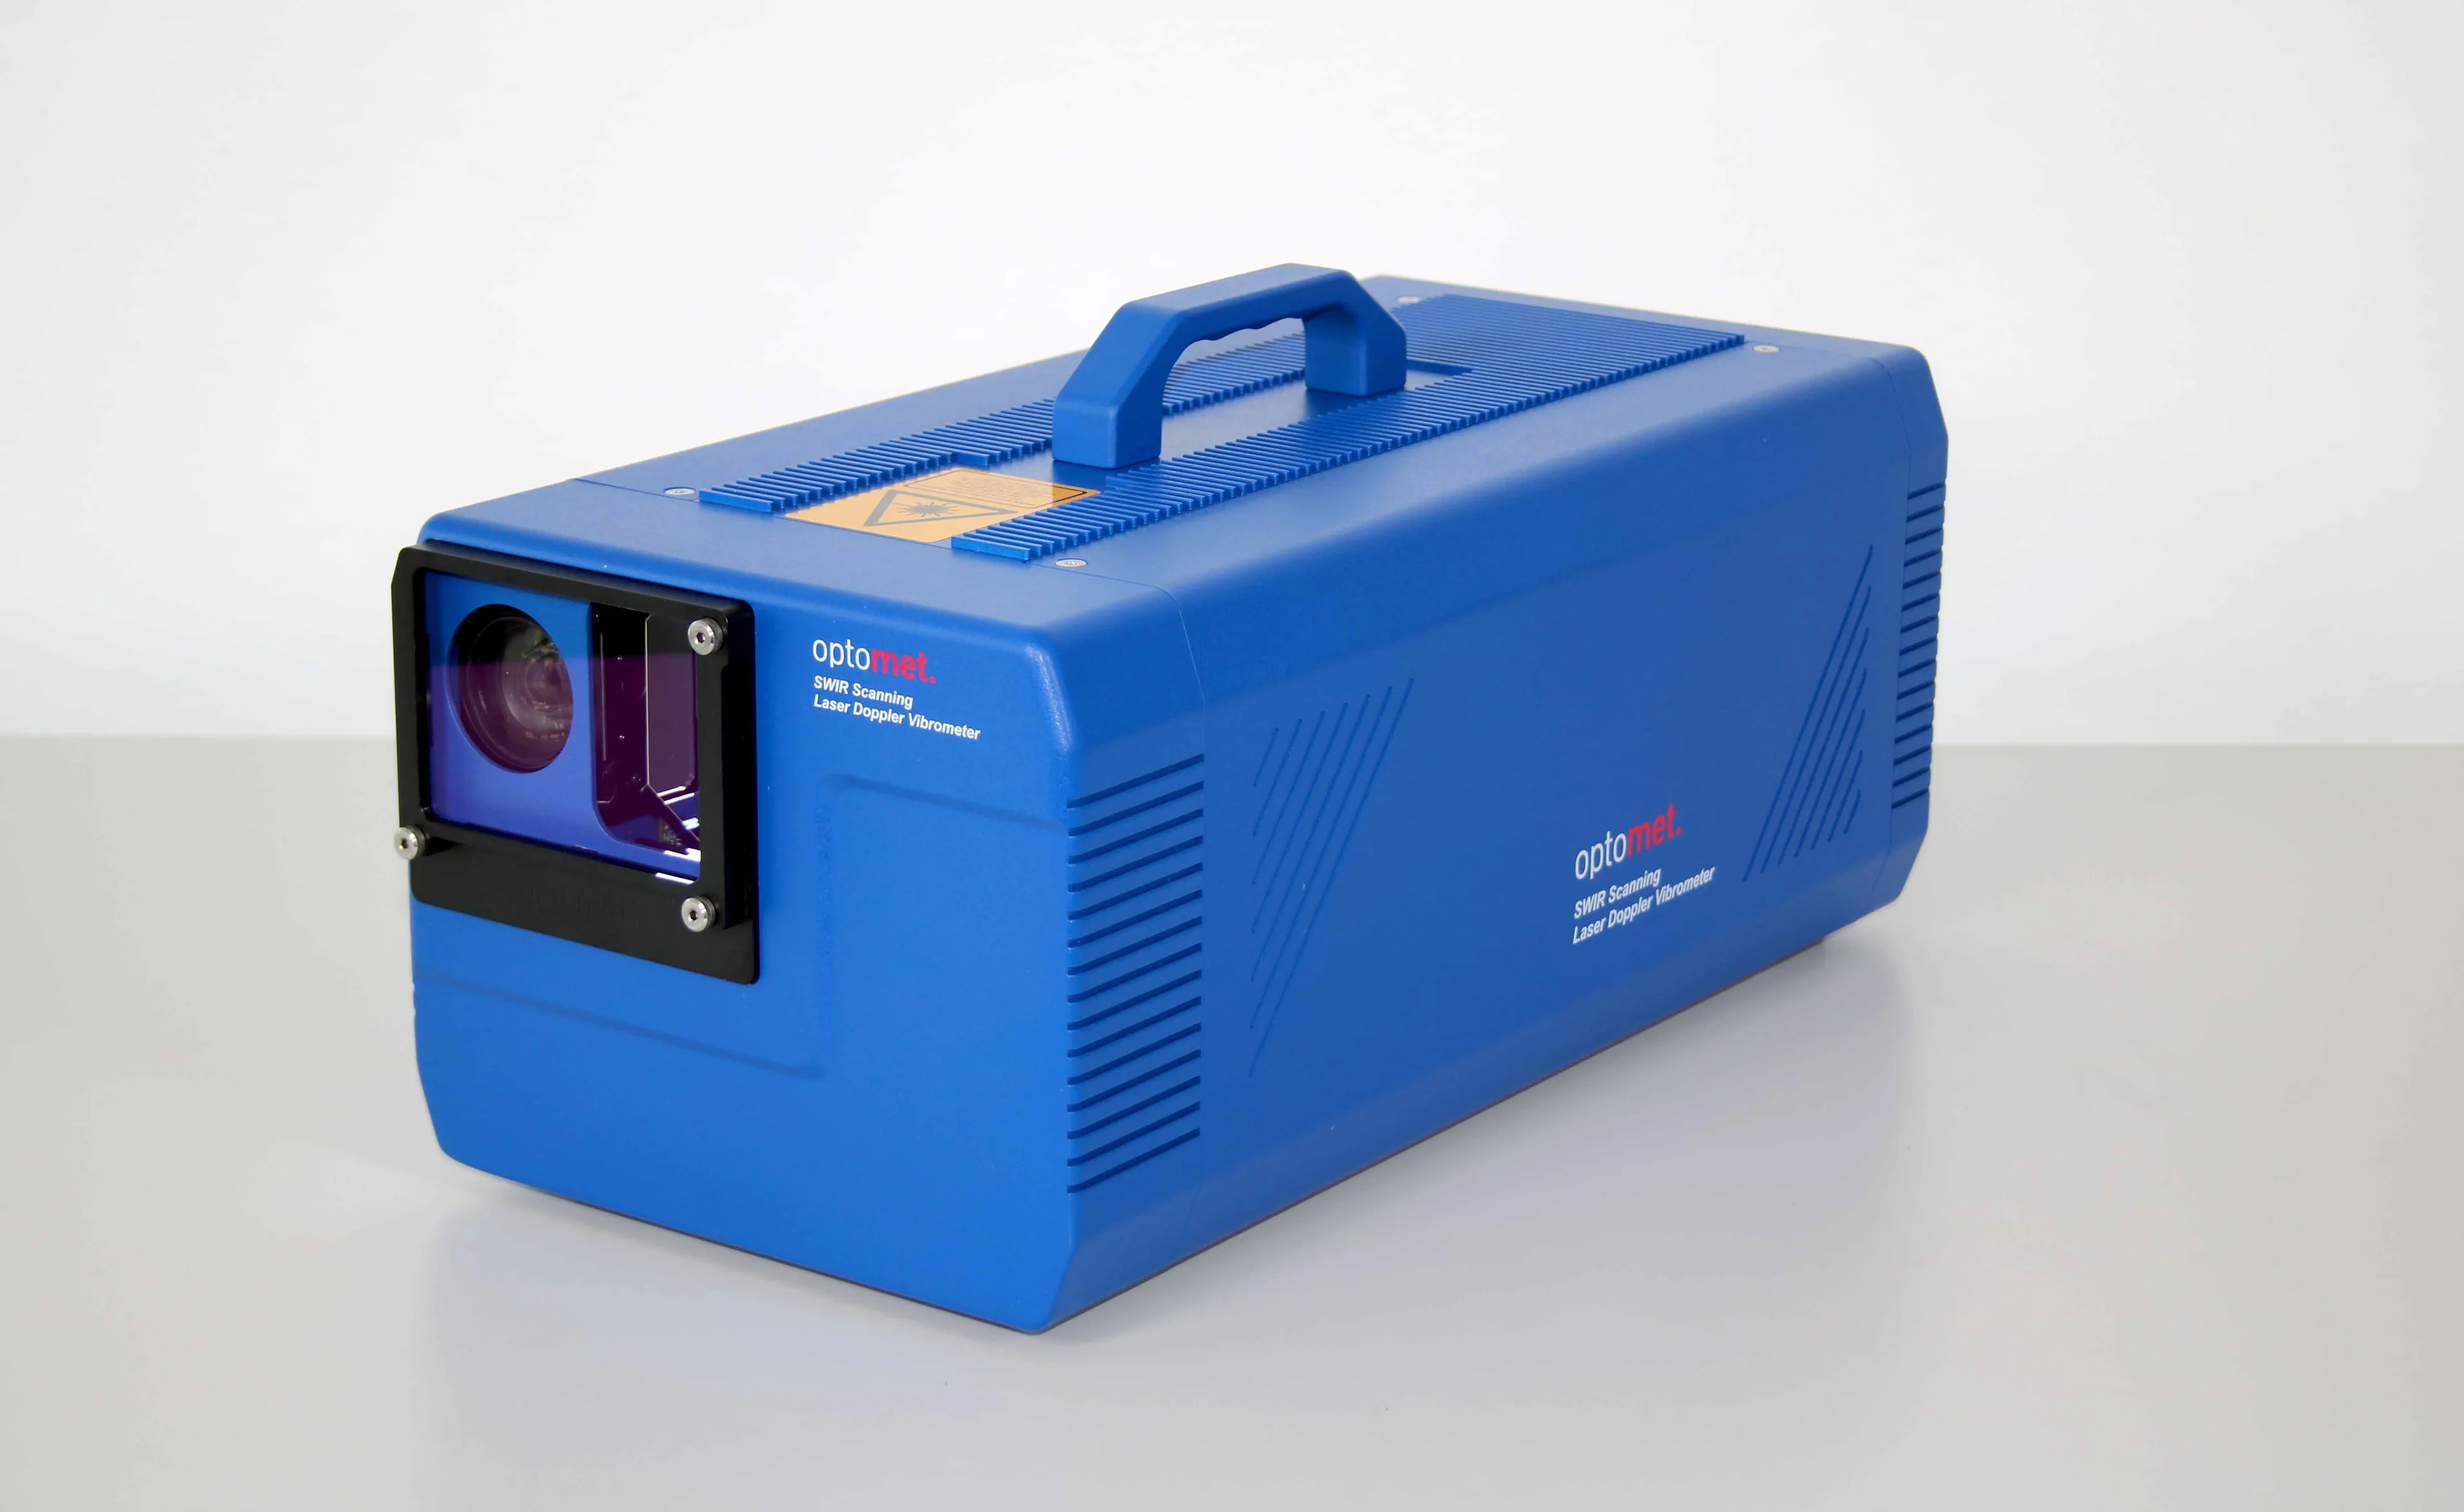
In combination with the Optomet scanning laser Doppler vibrometersthe OptoSCAN software provides a complete solution for imaging vibration measurements.
OptoSCAN combines point-by-point scan data with geometry information to animate vibrations and surface waves of nearly any test object for design optimization, structural problem-solving, FE model validation, and fundamental research. The data is displayed in numerous time- and frequency-based formats.
Vibrometer control
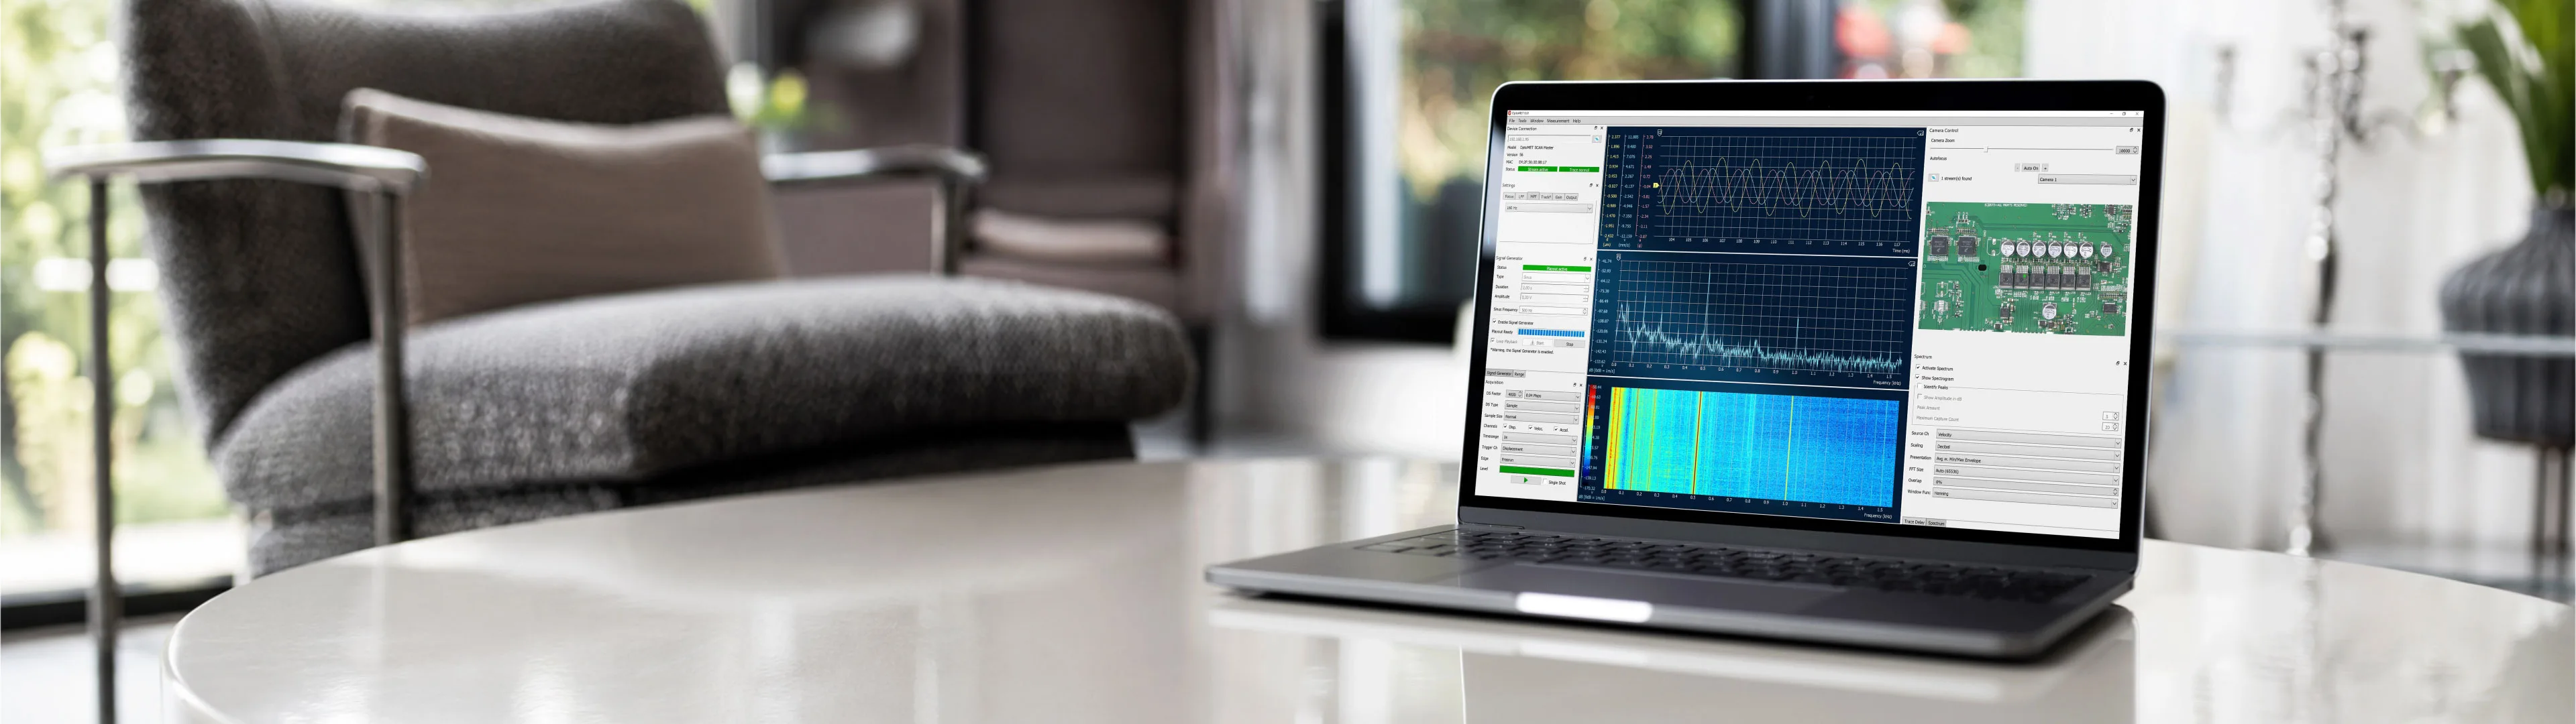
OptoSCAN remotely controls all hardware settings and components of the scanning vibrometer. The video camera and measurement laser are calibrated, decoders and measurement ranges are defined, channels for measurement and reference signals are set, and the built-in signal generator is controlled.
Imaging vibration measurement
Grids for measurement points can be created and edited with just a few clicks. Even complex geometries can be created easily and intuitively. After defining measurement duration, bandwidth, frequency resolution, and quality requirements for point measurements, the measurement scan can be started. The color coding of the grid points indicates scan progress and provides information about the status of individual points after the scan.
Visualization and analysis
Results are clearly displayed in charts, and waveforms can be shown as two-dimensional maps or three-dimensional animated time profiles. Easy switching between time and frequency representation allows for comprehensive analysis of the measurements. Resonances, transfer functions, vibration modes, operational vibrations, or wave propagation are clearly visualized.
Measurements are displayed in real-time during the scan, and full analysis is possible immediately after the scan is completed, without needing to switch to a special analysis mode.
Offline processing is possible with a desktop version of OptoSCAN. Using the integrated video creation tool, results can be quickly and effectively reported or shared.
Storage and data exchange
OptoSCAN projects are neatly saved and can be reloaded with all settings for future analysis. Extensive export options are available for further processing of measurement data outside of OptoSCAN. Documented and open file formats enable easy exchange with third-party programs, such as for modal analysis or with standard software like MATLAB®.
Intuitive Operation
Operating OptoSCAN is very straightforward. The user interface is designed around the typical workflow of a scanning vibrometer measurement: defining the measurement project, selecting channels and measurement ranges, defining geometry and measurement points, choosing acquisition parameters, and finally, displaying and analyzing the measurement results. New users are intuitively guided through the measurement process, while experienced users can enjoy comprehensive functionality.
Further Information
Details about the functions of the vibrometer and the OptoSCAN software can be found in thedatasheet of the Laser Scanning Vibrometer.

Vibration measurement in research, development and industry – Optomet offers the right solution for your requirements.
Contact