
Video Gallery
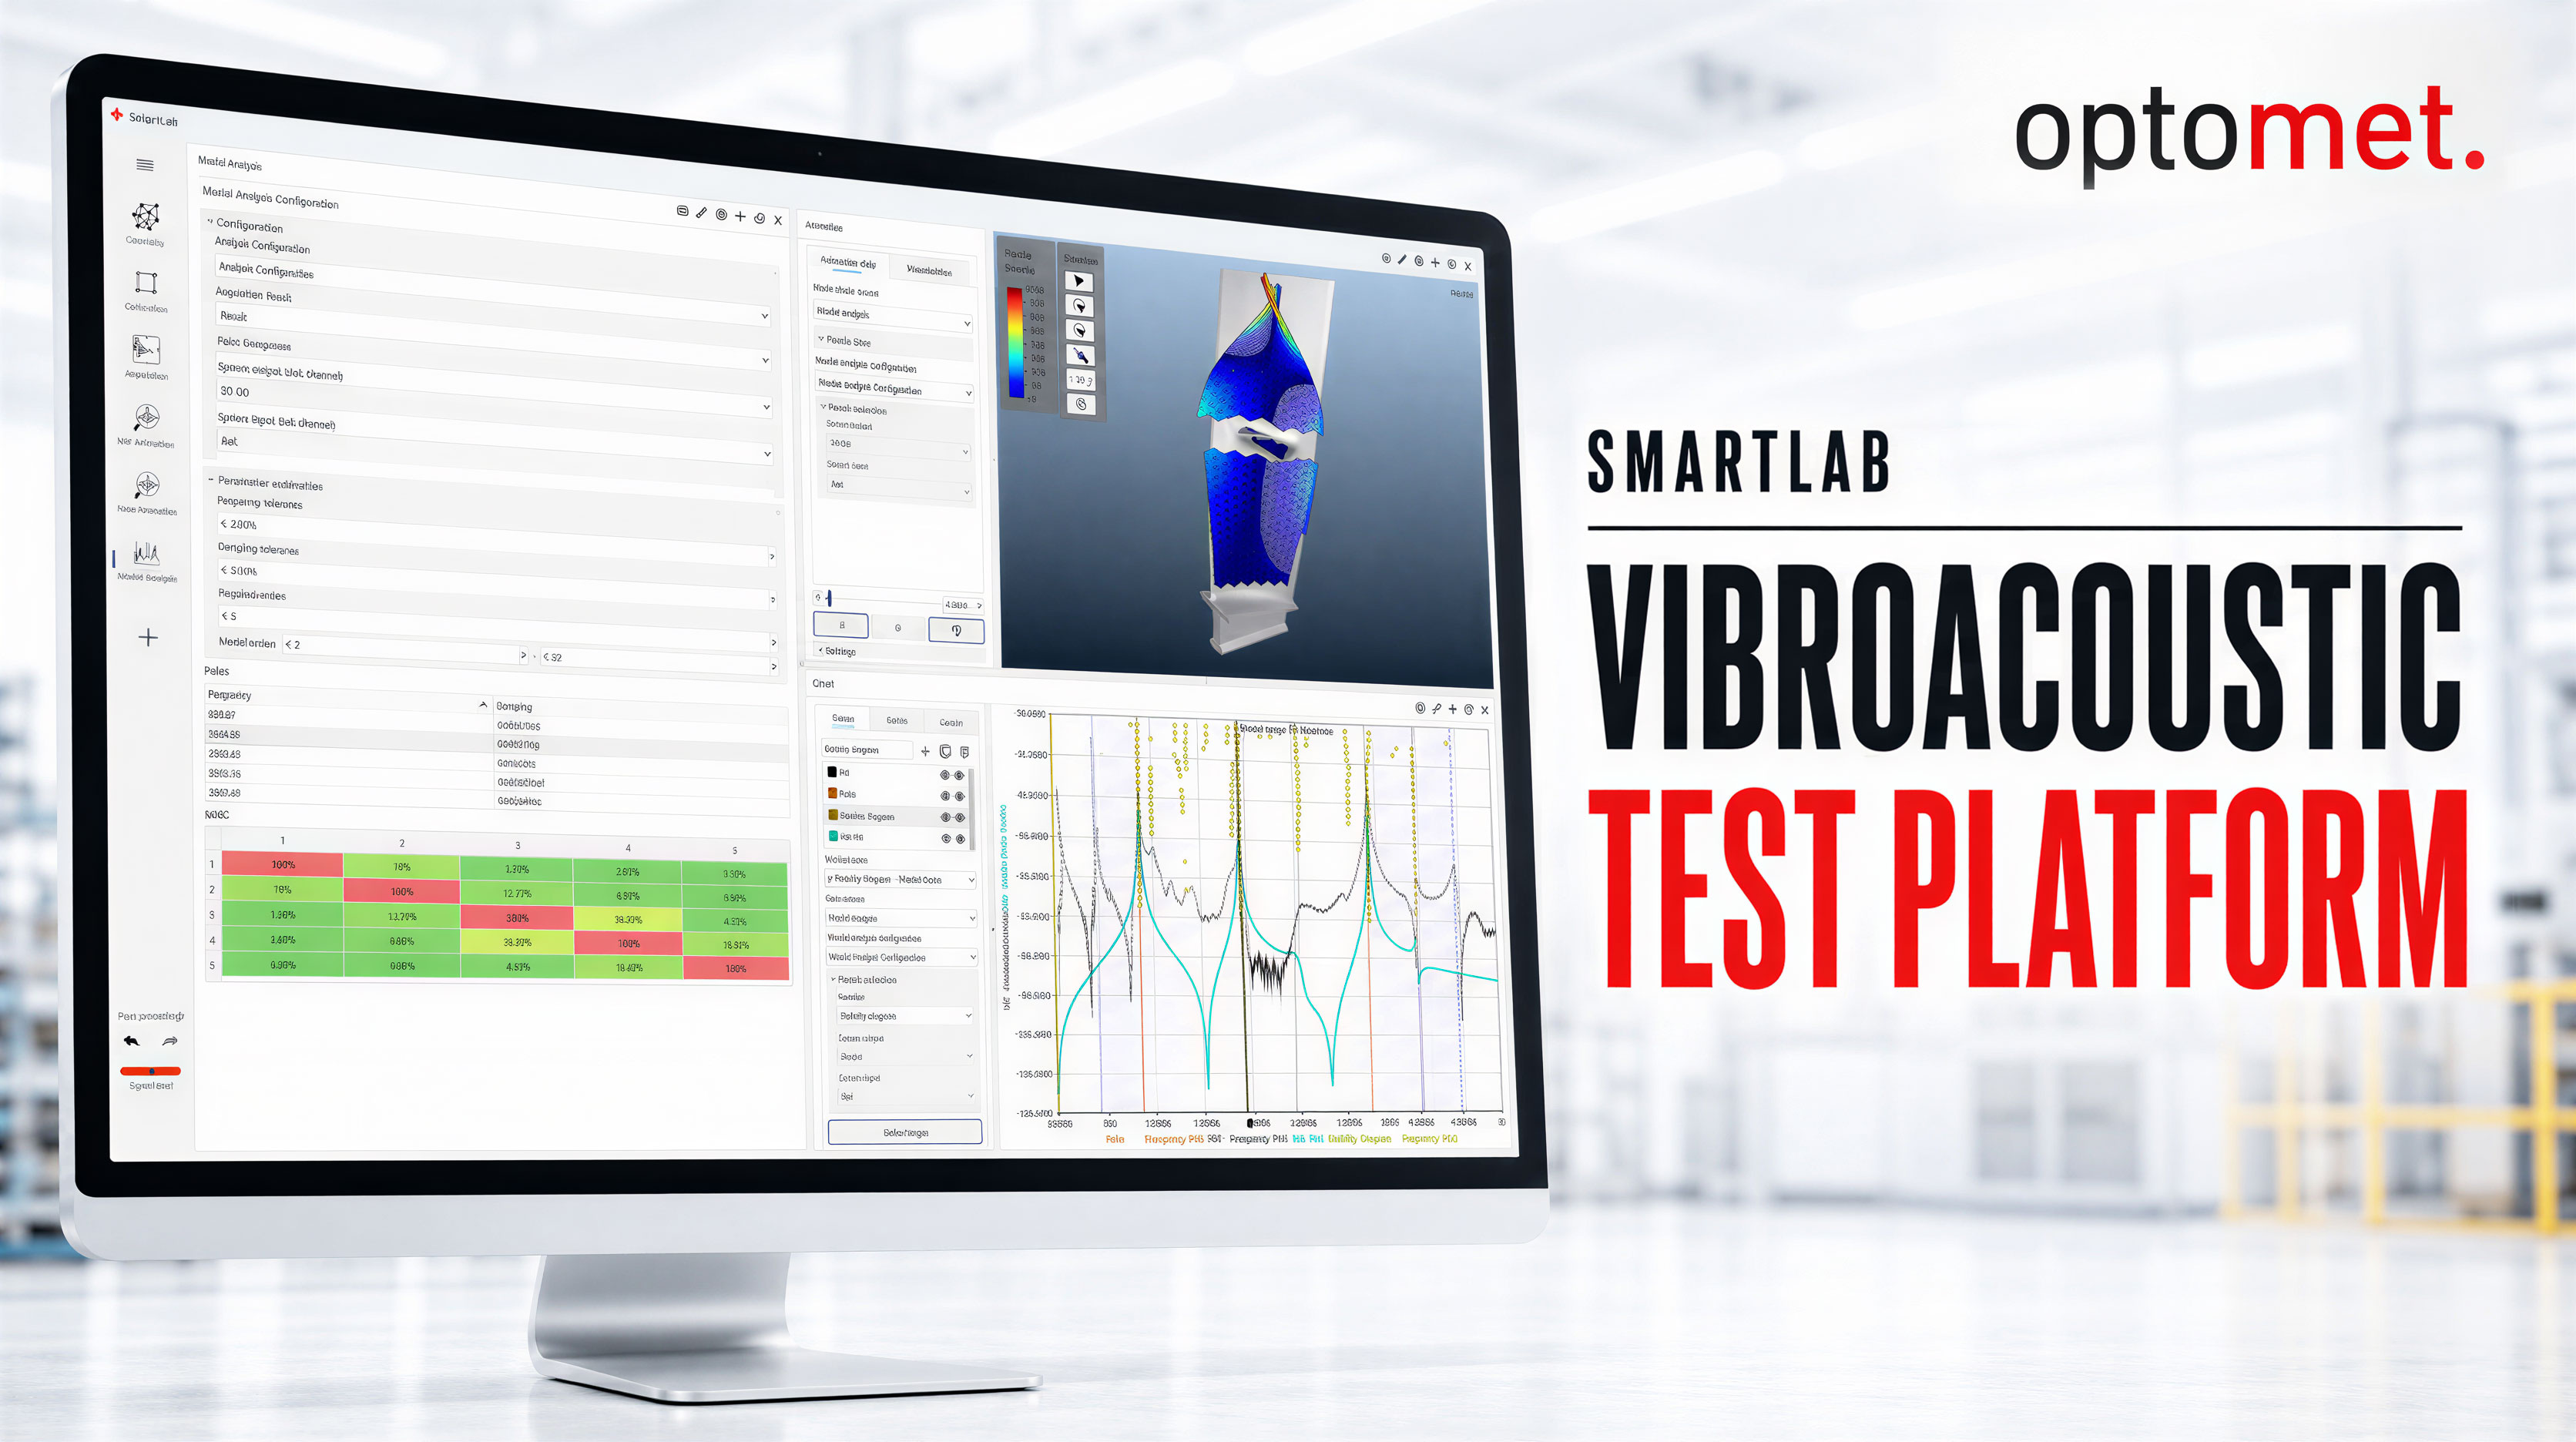
SmartLab - Vibroacoustic Test Platform
SmartLab is the measurement software for the Optomet SMART Series. The video demonstrates the workflow from template setup and 3D model import through calibration and measurement. FRF animations, time data, and modal analysis are all displayed in a single environment. [2025 | 1:06 min]
Open video page →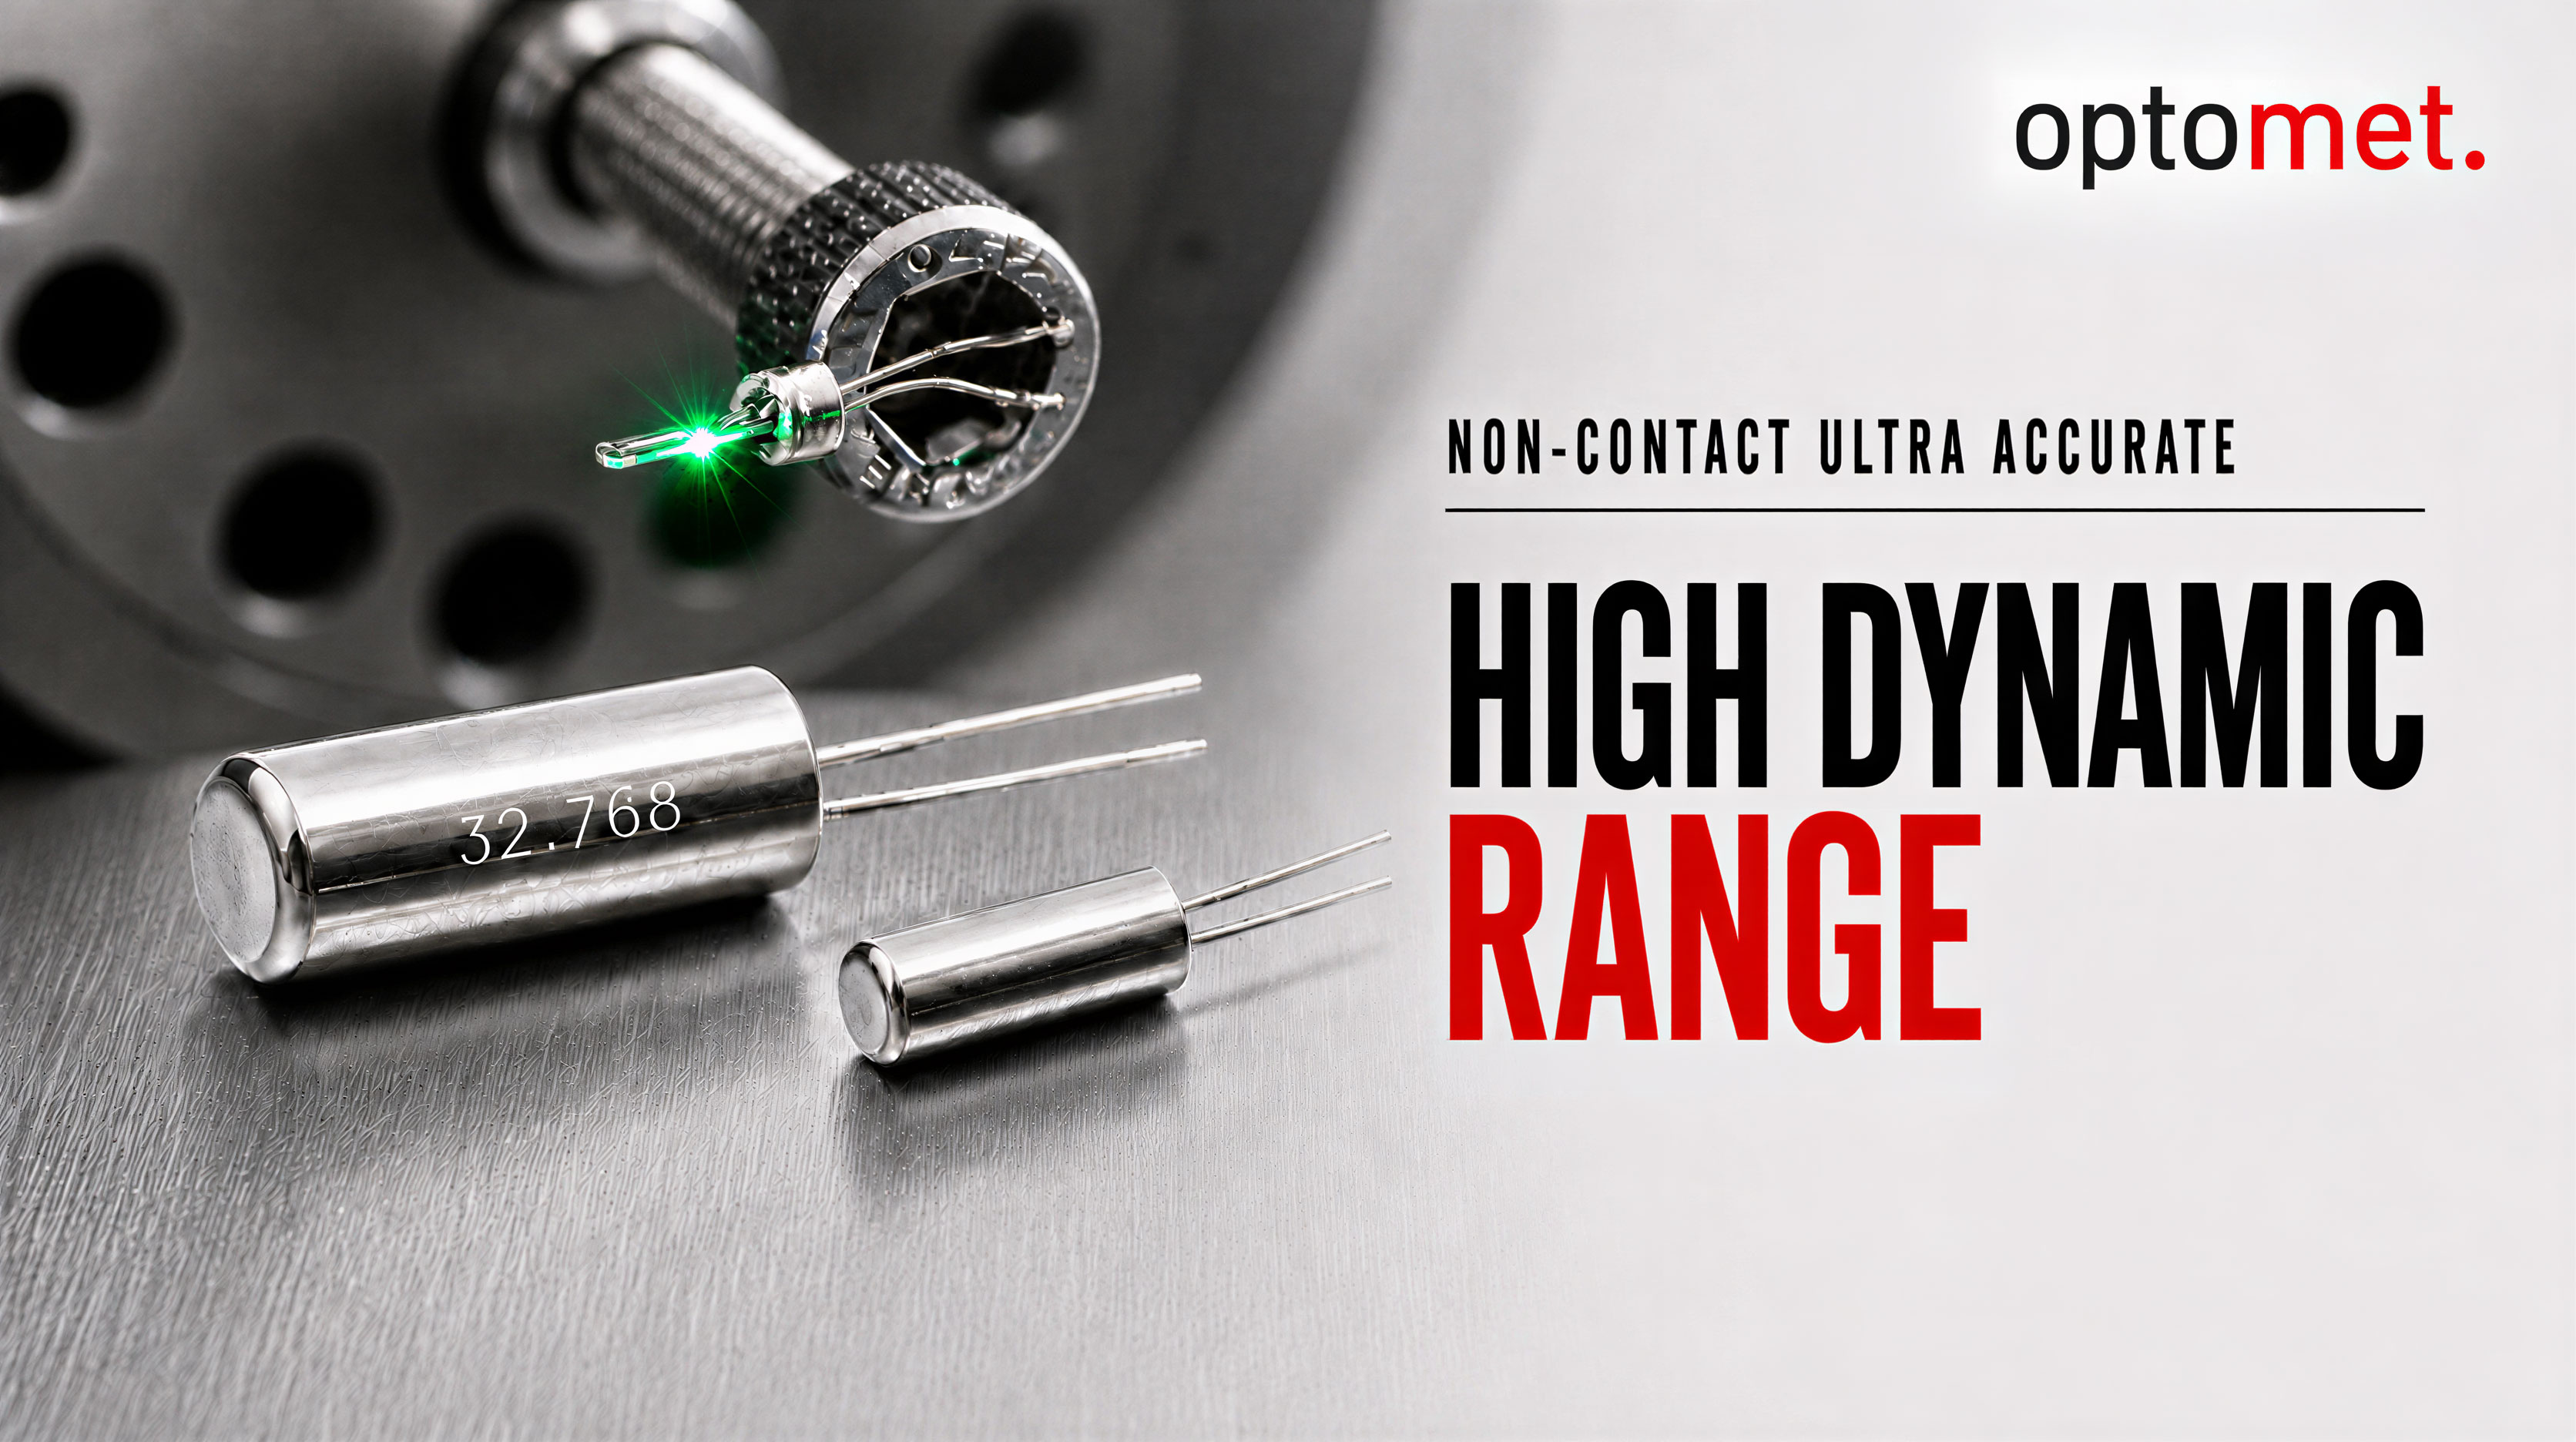
High Dynamic Range
Demonstration of the dynamic range using a quartz clock movement: The shaker moves the component macroscopically, while the vibrometer simultaneously resolves the 32.768 kHz quartz oscillation in the nanometer range. 11 orders of magnitude in a single measurement. [2019| 1:24 min]
Open video page →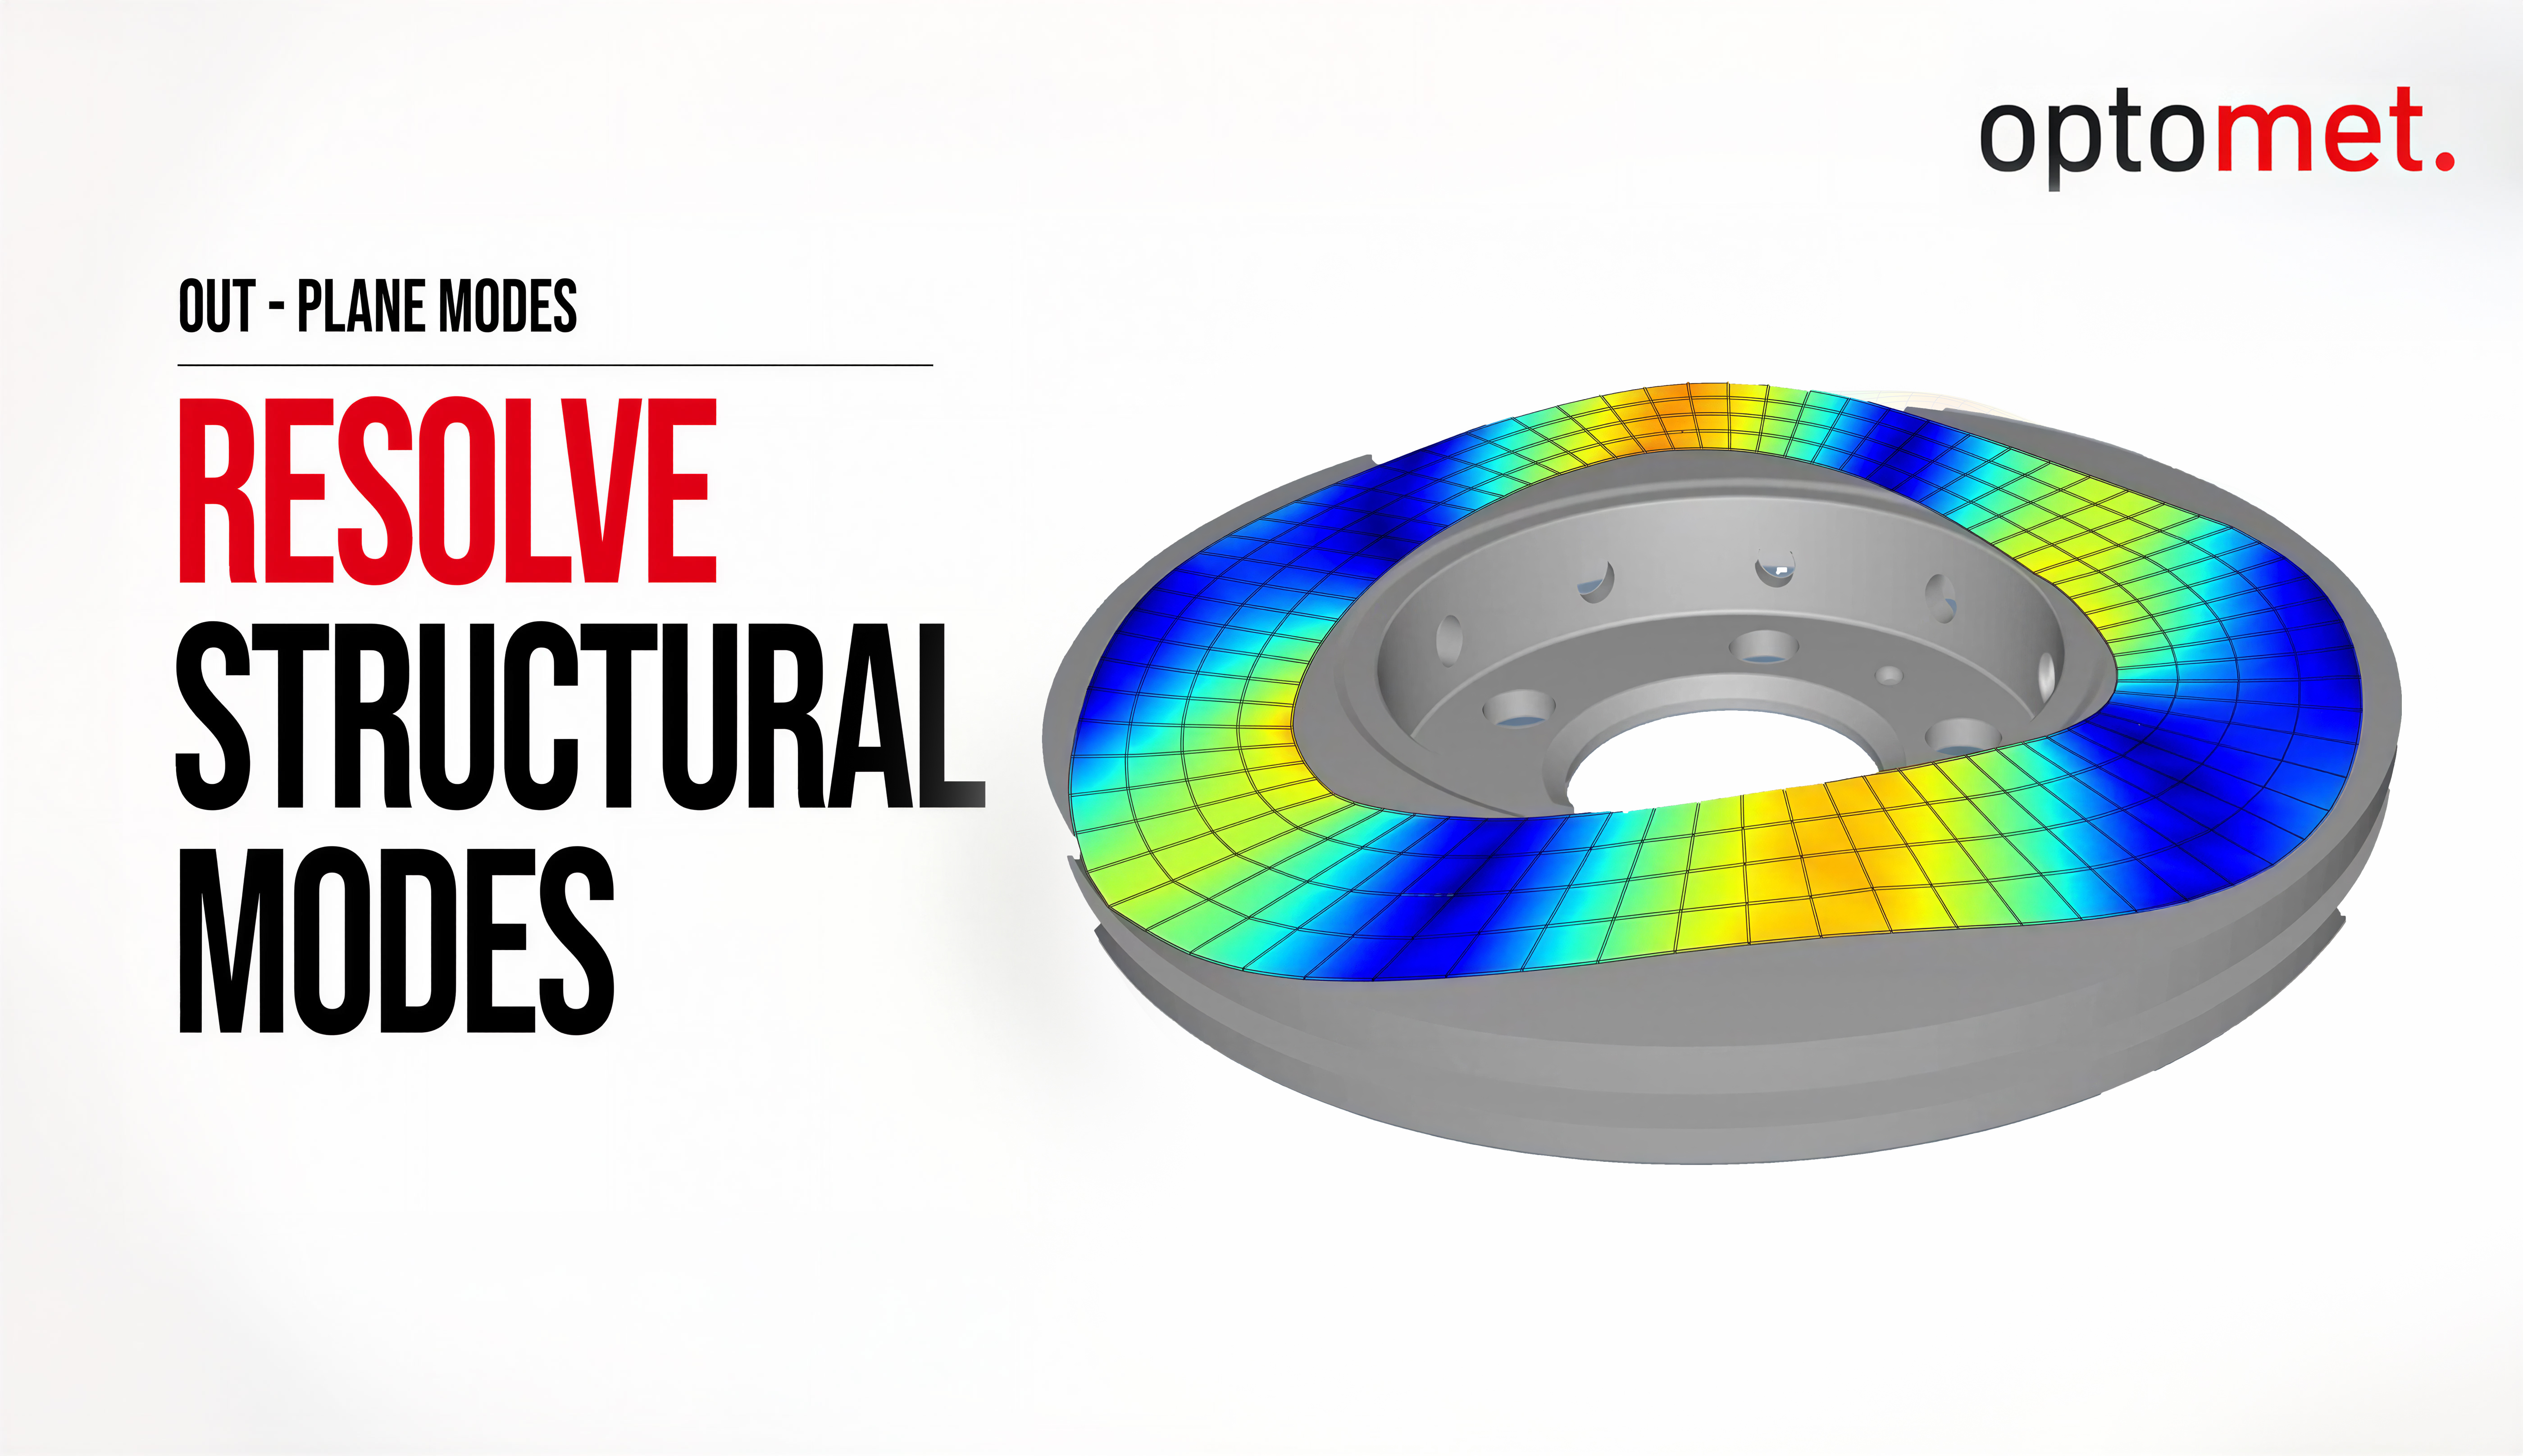
Out-of-plane vibration of a brake disc at 6 kHz
Short animation from SmartLab: the out-of-plane mode shape (motion perpendicular to the disc surface) of a brake disc at 6 kHz, measured non-contact using laser Doppler vibrometry. [2025 | 0:10 min]
Open video page →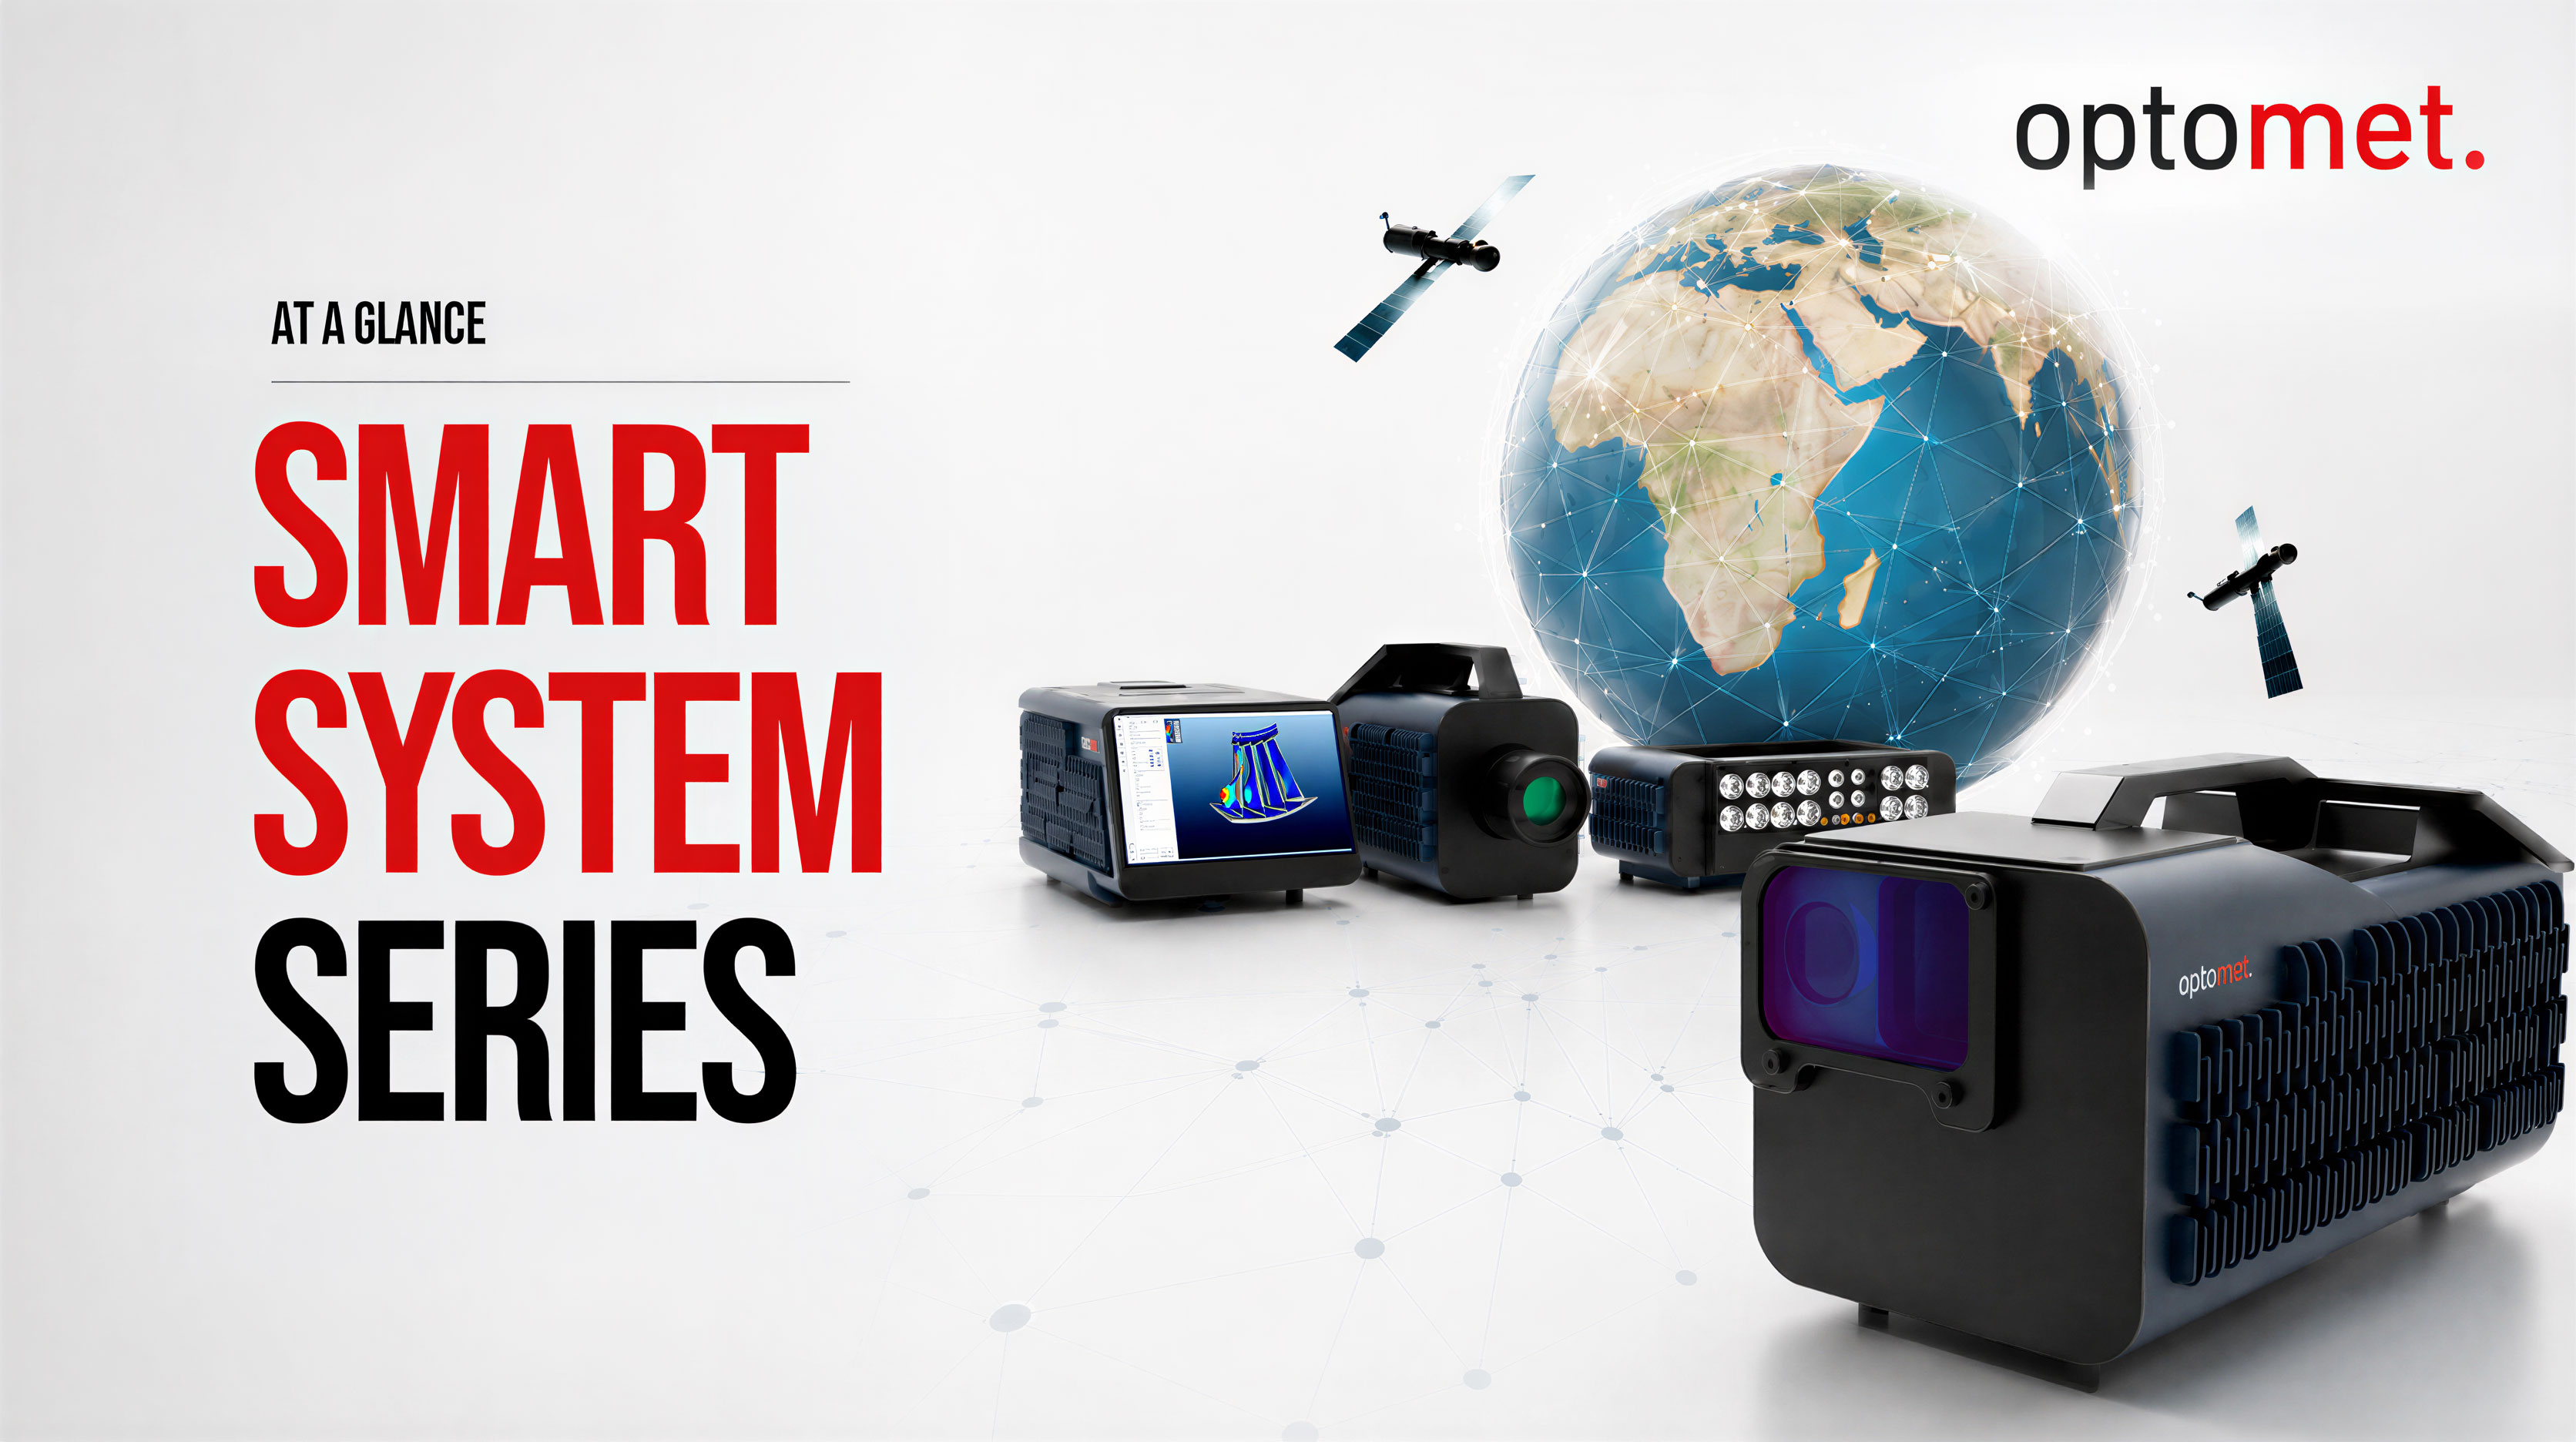
Optomet SMART Platform - Lab-in-a-Device
Product video on the SMART platform: vibrometer, data acquisition, and analysis in a single device—the Lab-in-a-Device. The video showcases the SMART system concept, from SMART Single+ to SMART DAQ, and applications ranging from automotive engineering to turbines. [2024 | 2:38 min]
Open video page →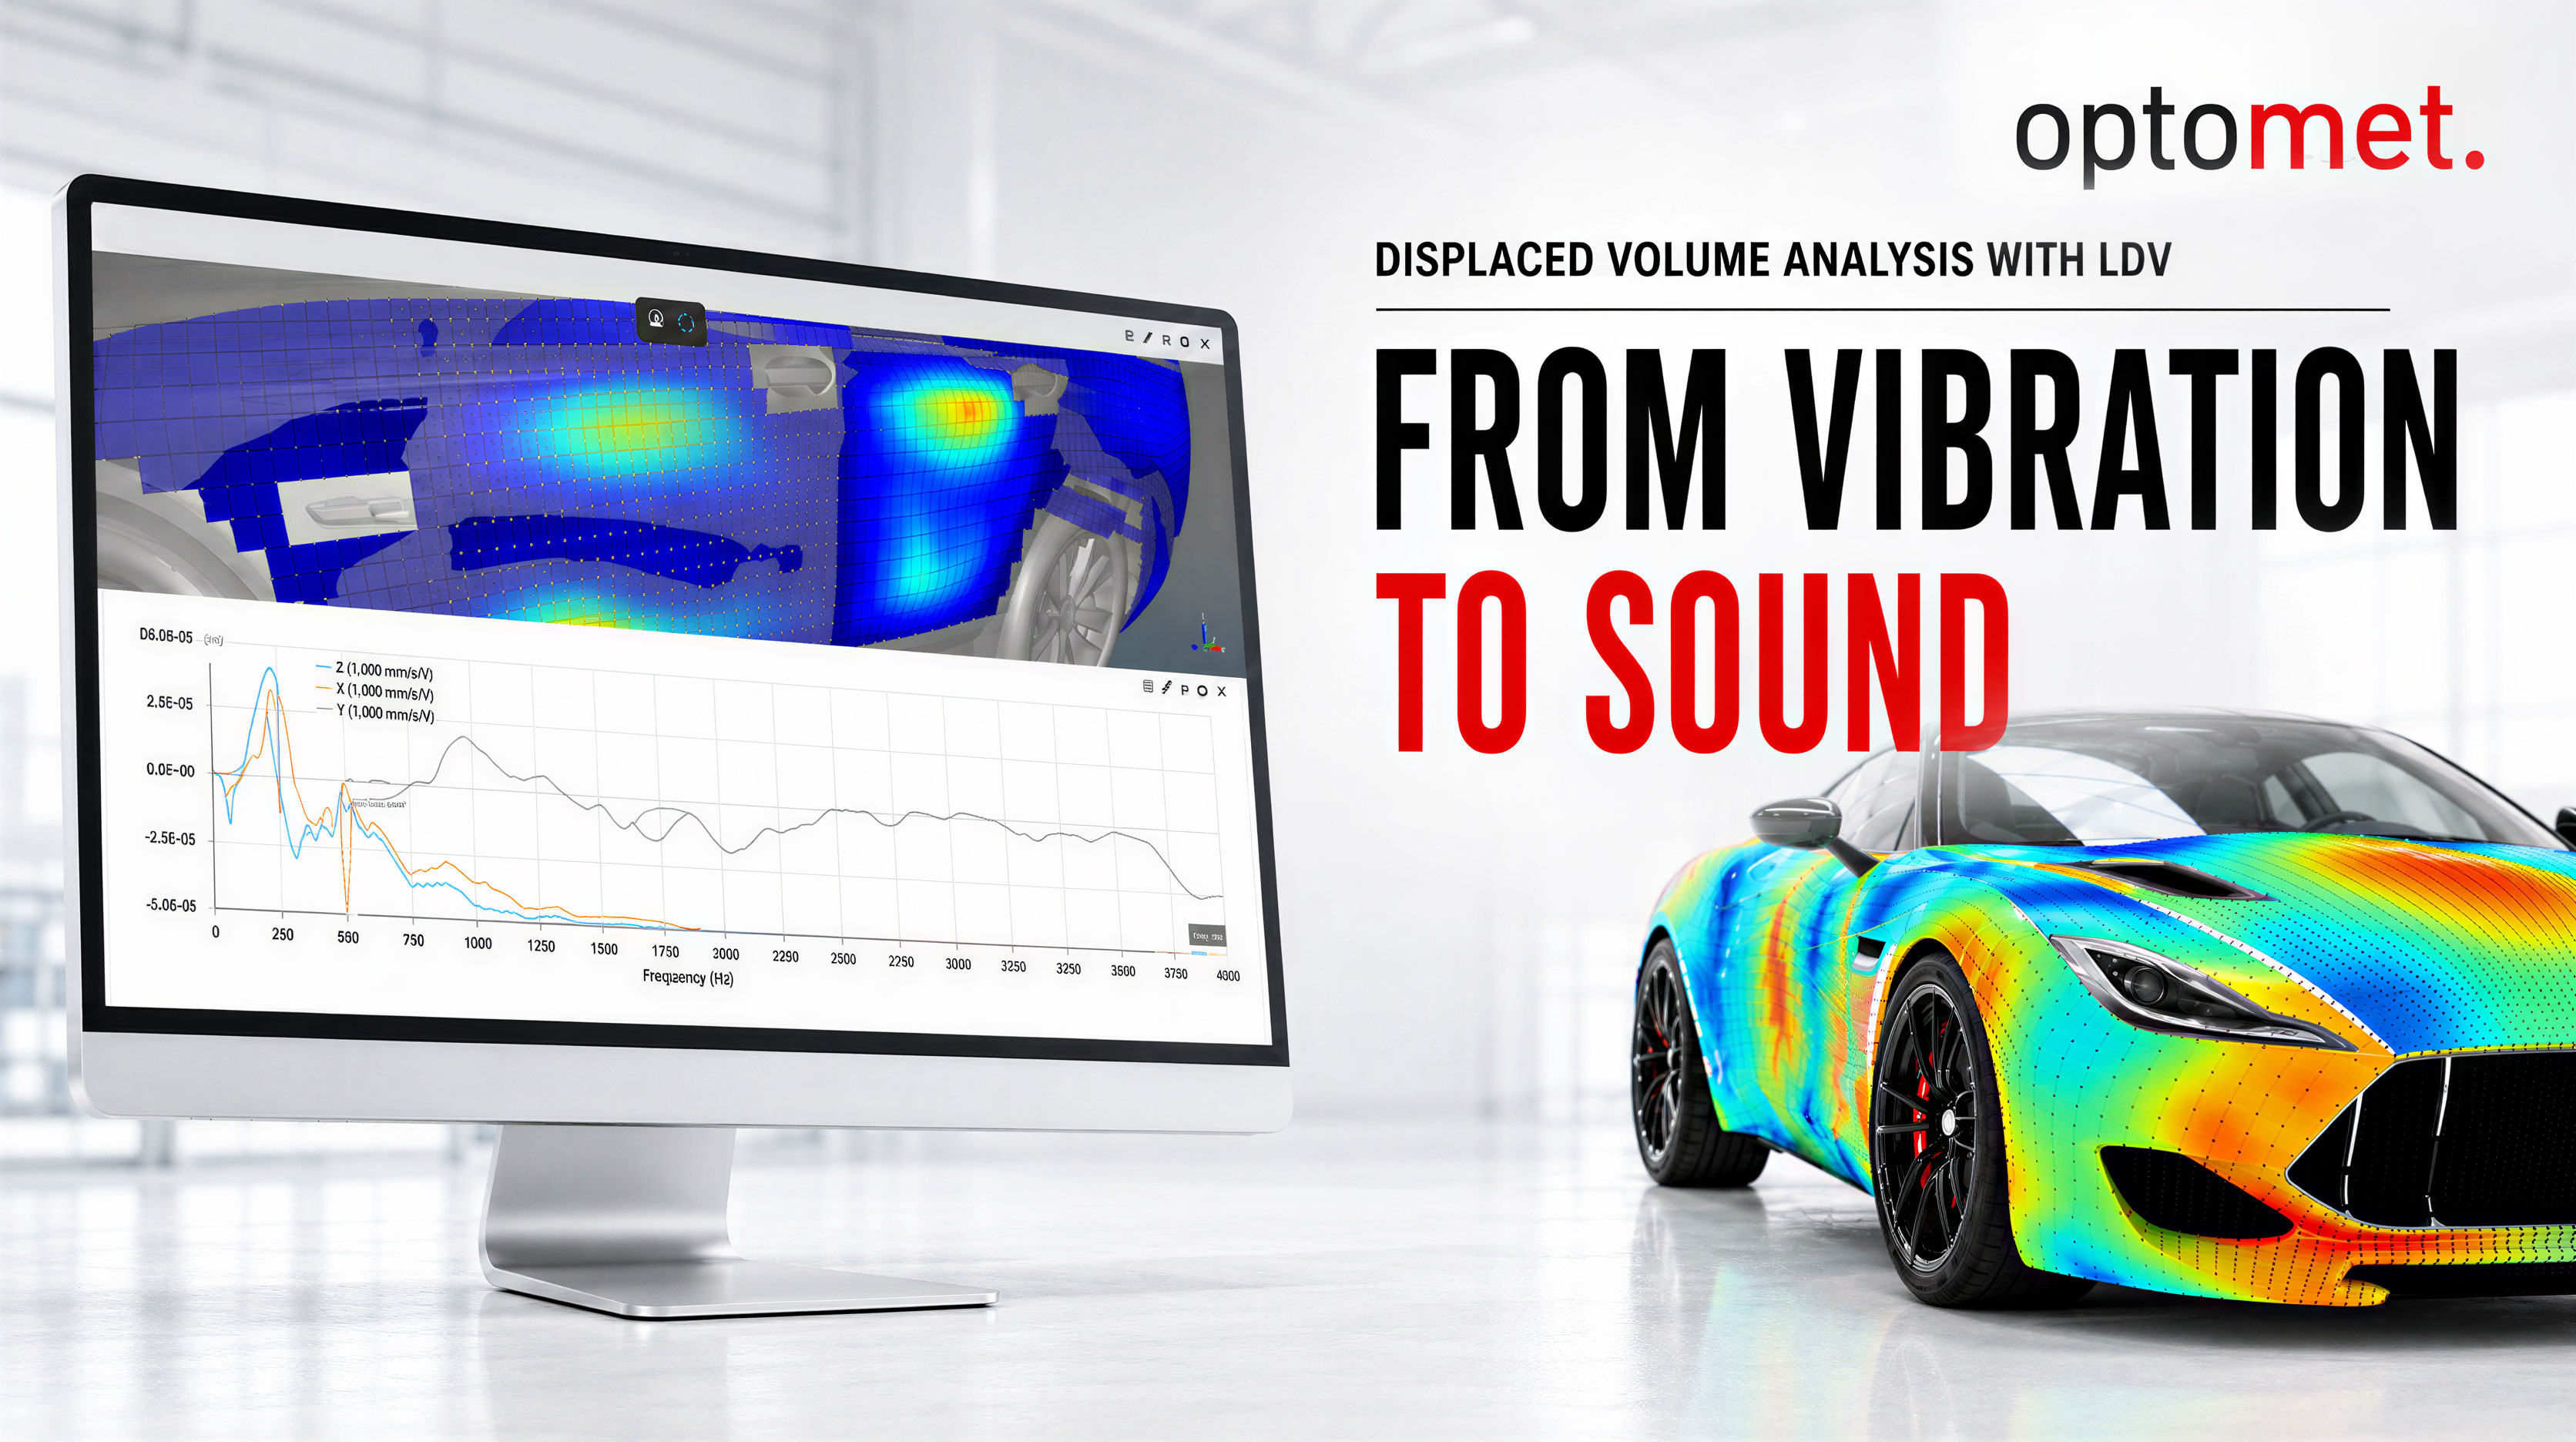
Displaced Volume Analysis with LDV - From Vibration to Sound
The displacement volume analysis in SmartLab calculates the displaced air volume from vibration data, demonstrated using a car door. This reveals why strong vibration does not always generate sound: the acoustic short circuit. [2026 | 1:34 min]
Open video page →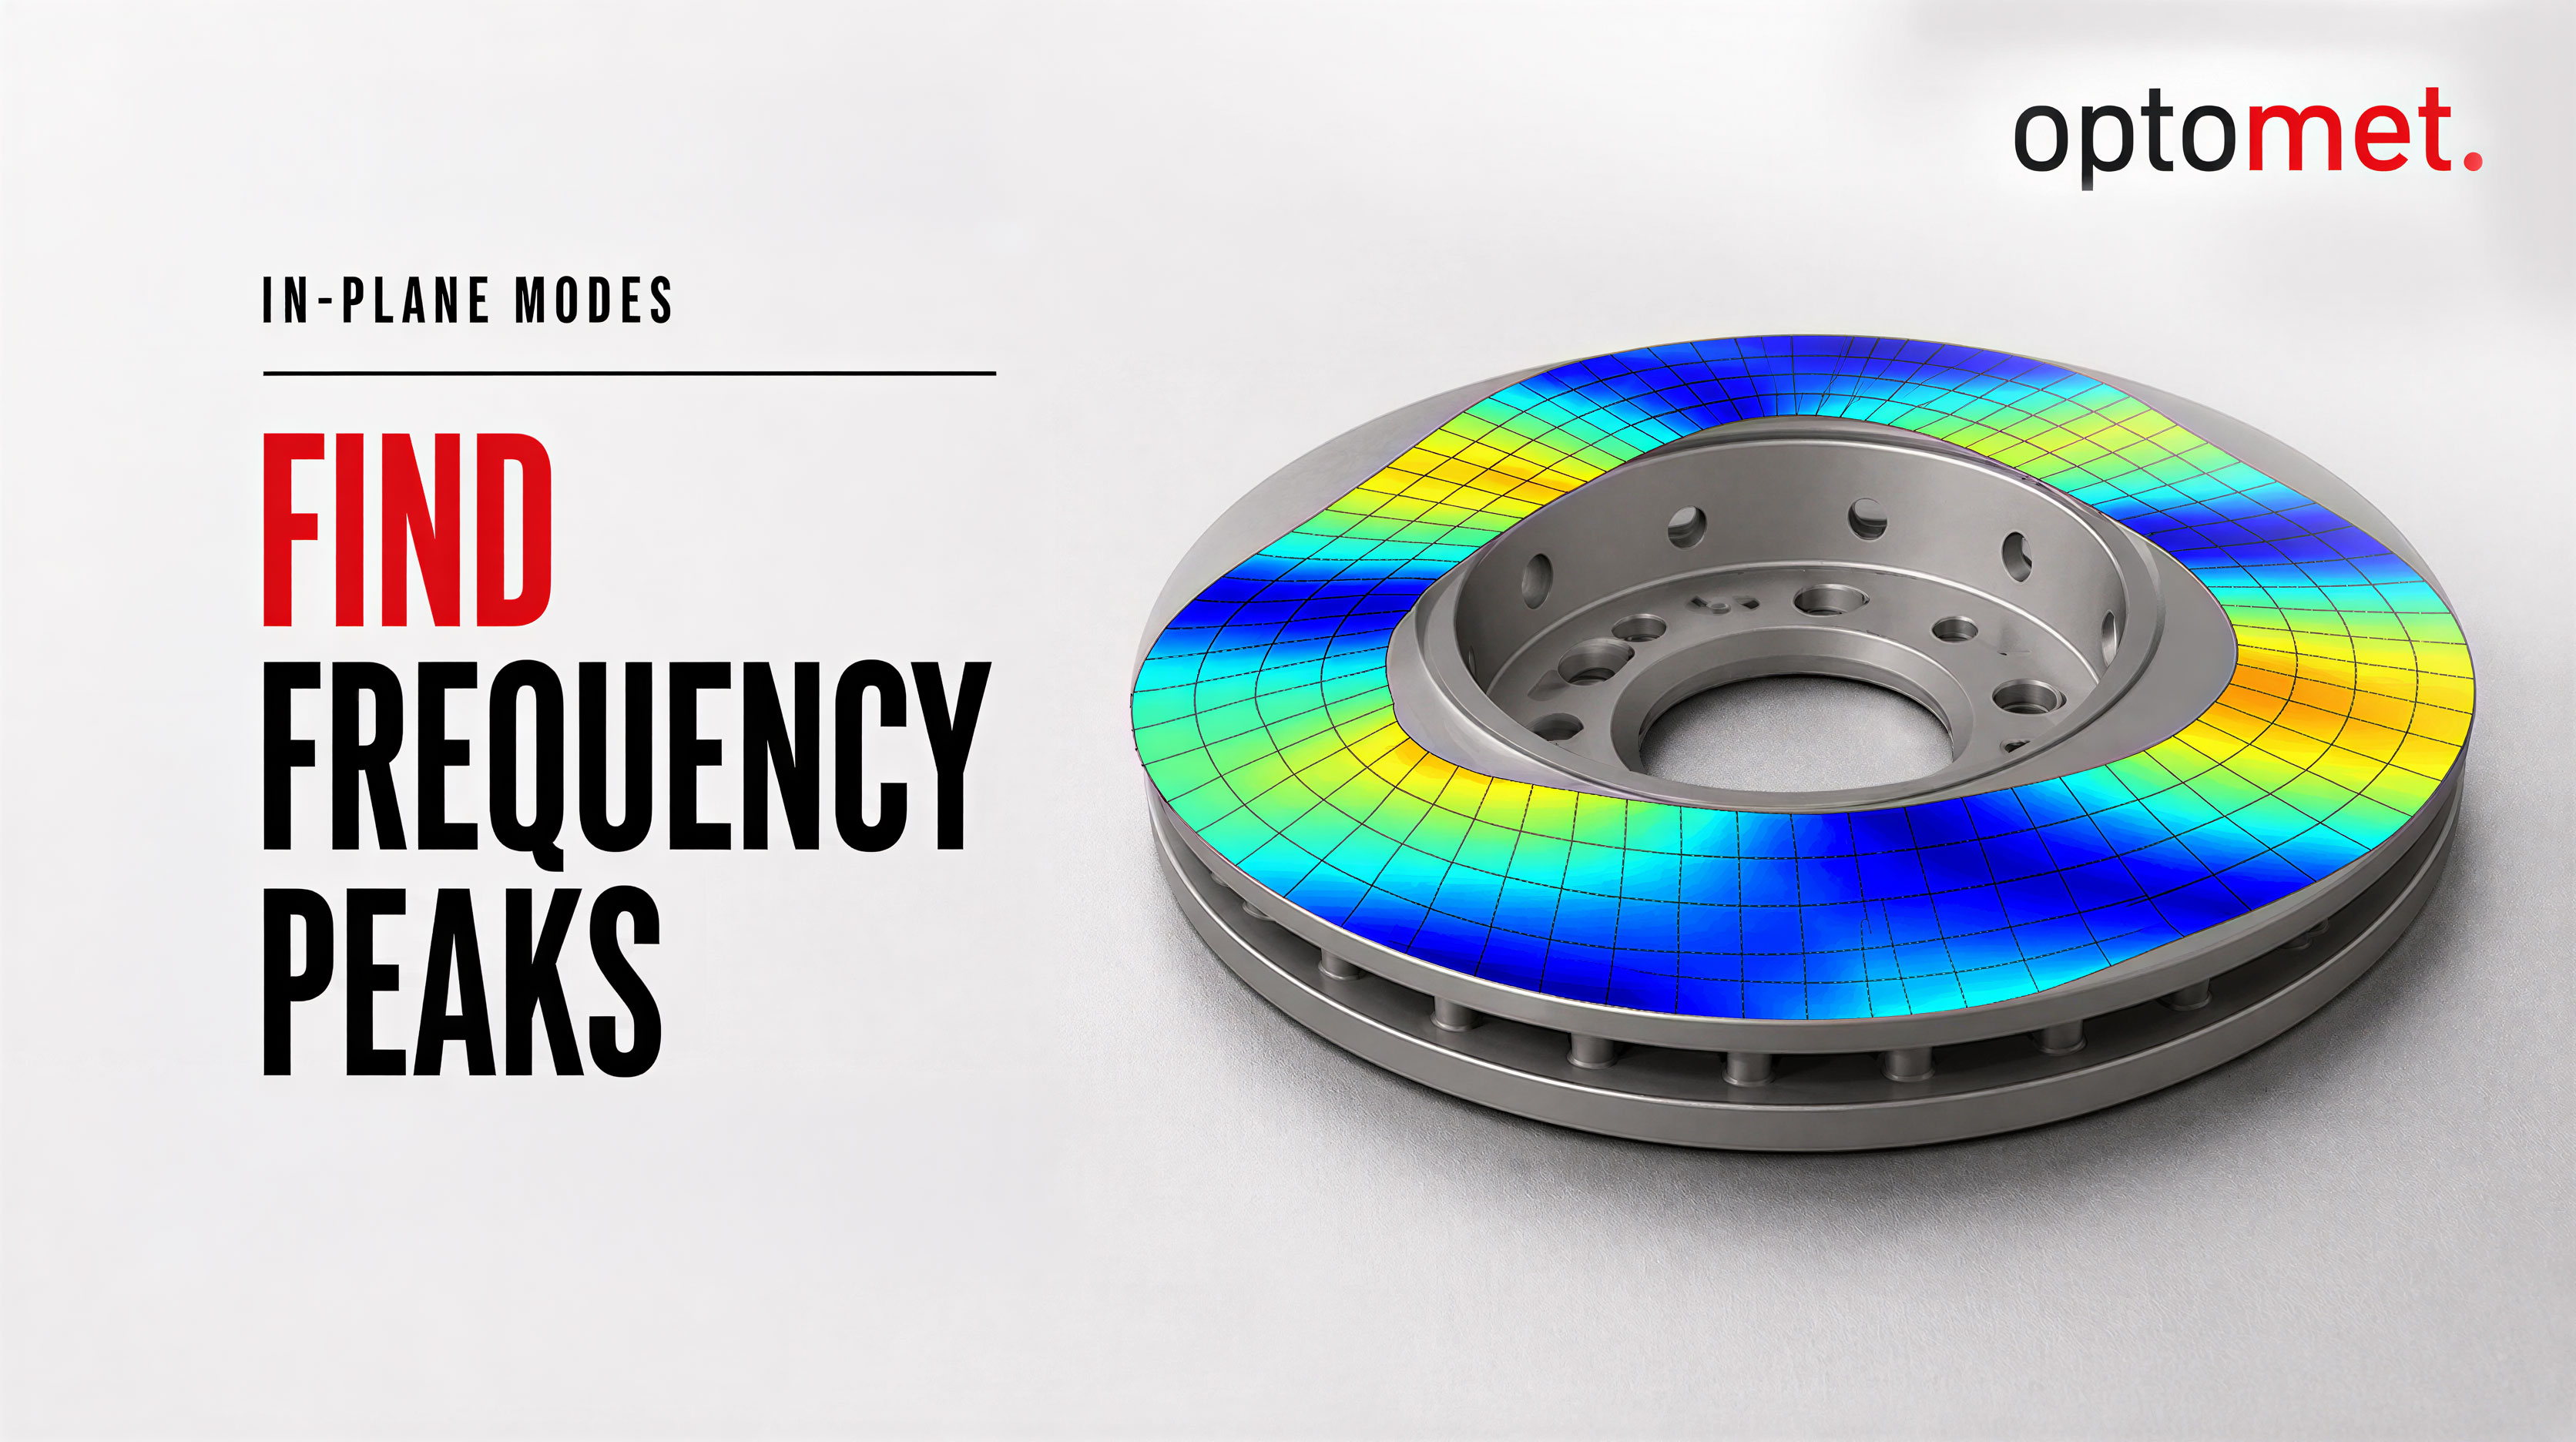
In-plane vibration of a brake disc at 6 kHz
Visualization of the in-plane vibration mode of a brake disc at 6 kHz, measured using 3D laser Doppler vibrometry. The animation shows the vibration components within the plane of the disc. [2025 | 0:09 min]
Open video page →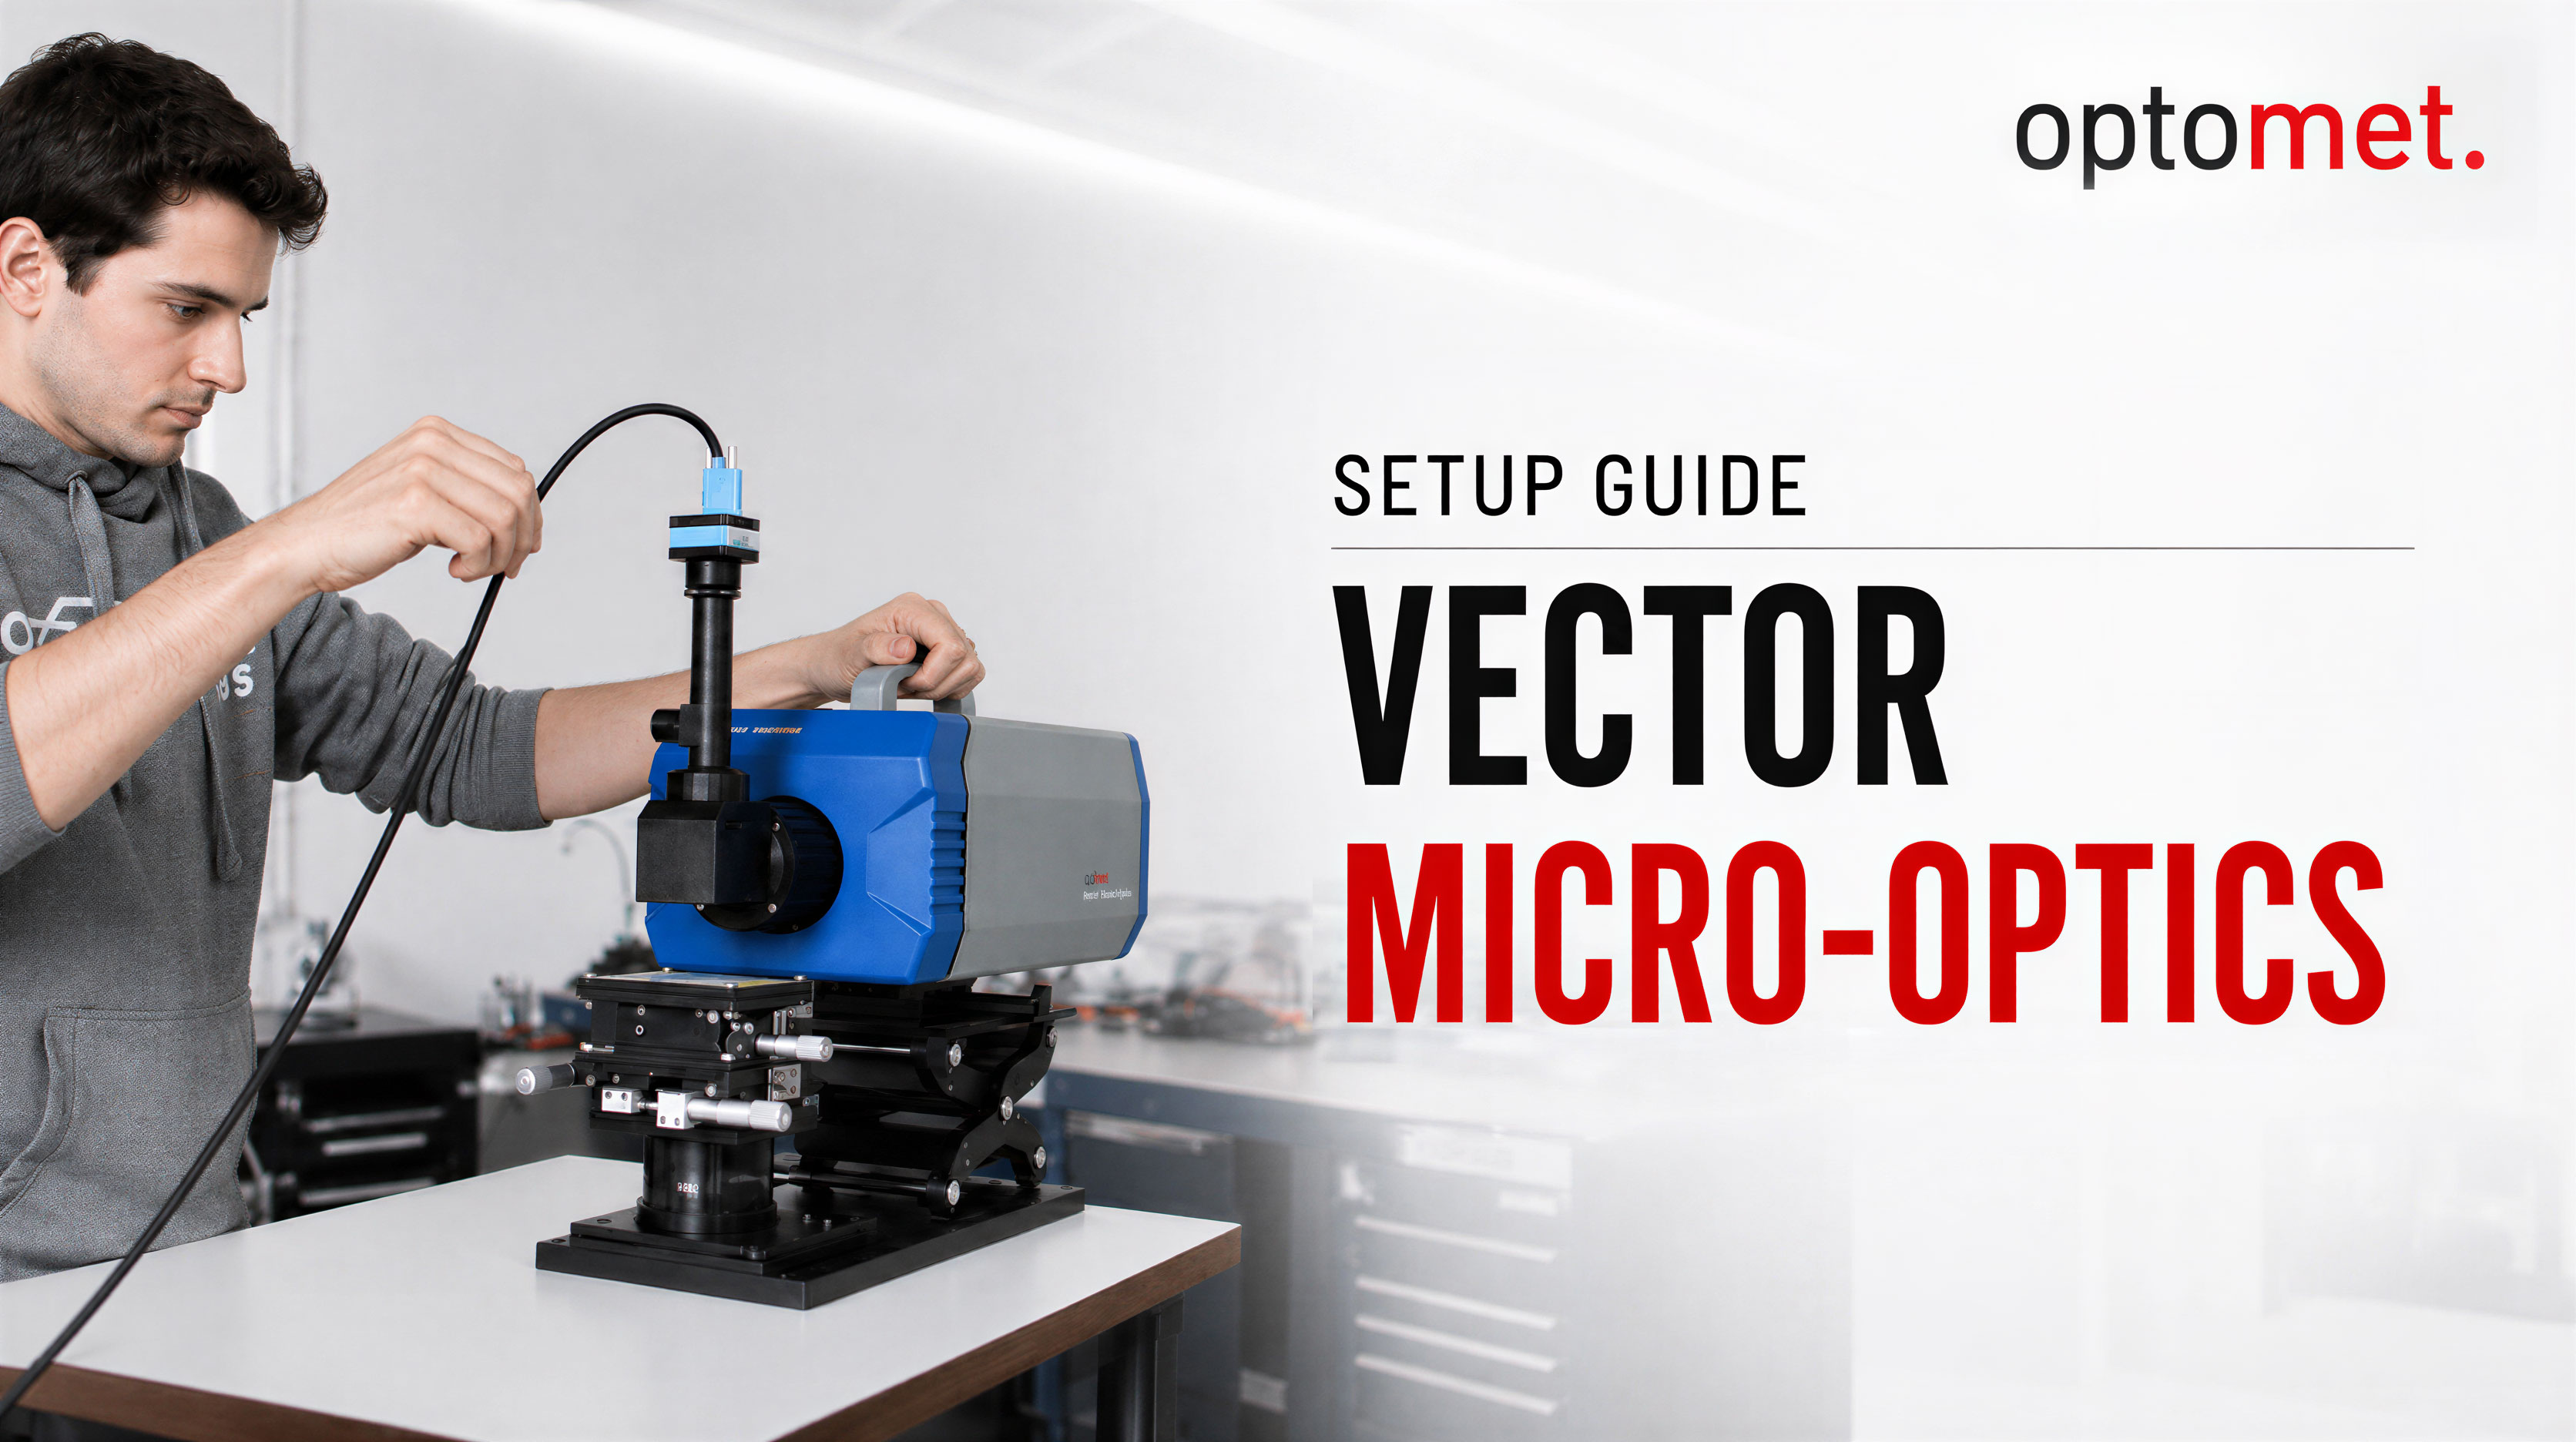
Vector Micro-Optics – setup guide
Step-by-step guide to setting up the Vector micro-optic: mounting it on the positioning stage, aligning it along three axes, and focusing the laser spot on the test object. The final result is a completed measurement in the OptoGUI software. [2022 | 1:23 min]
Open video page →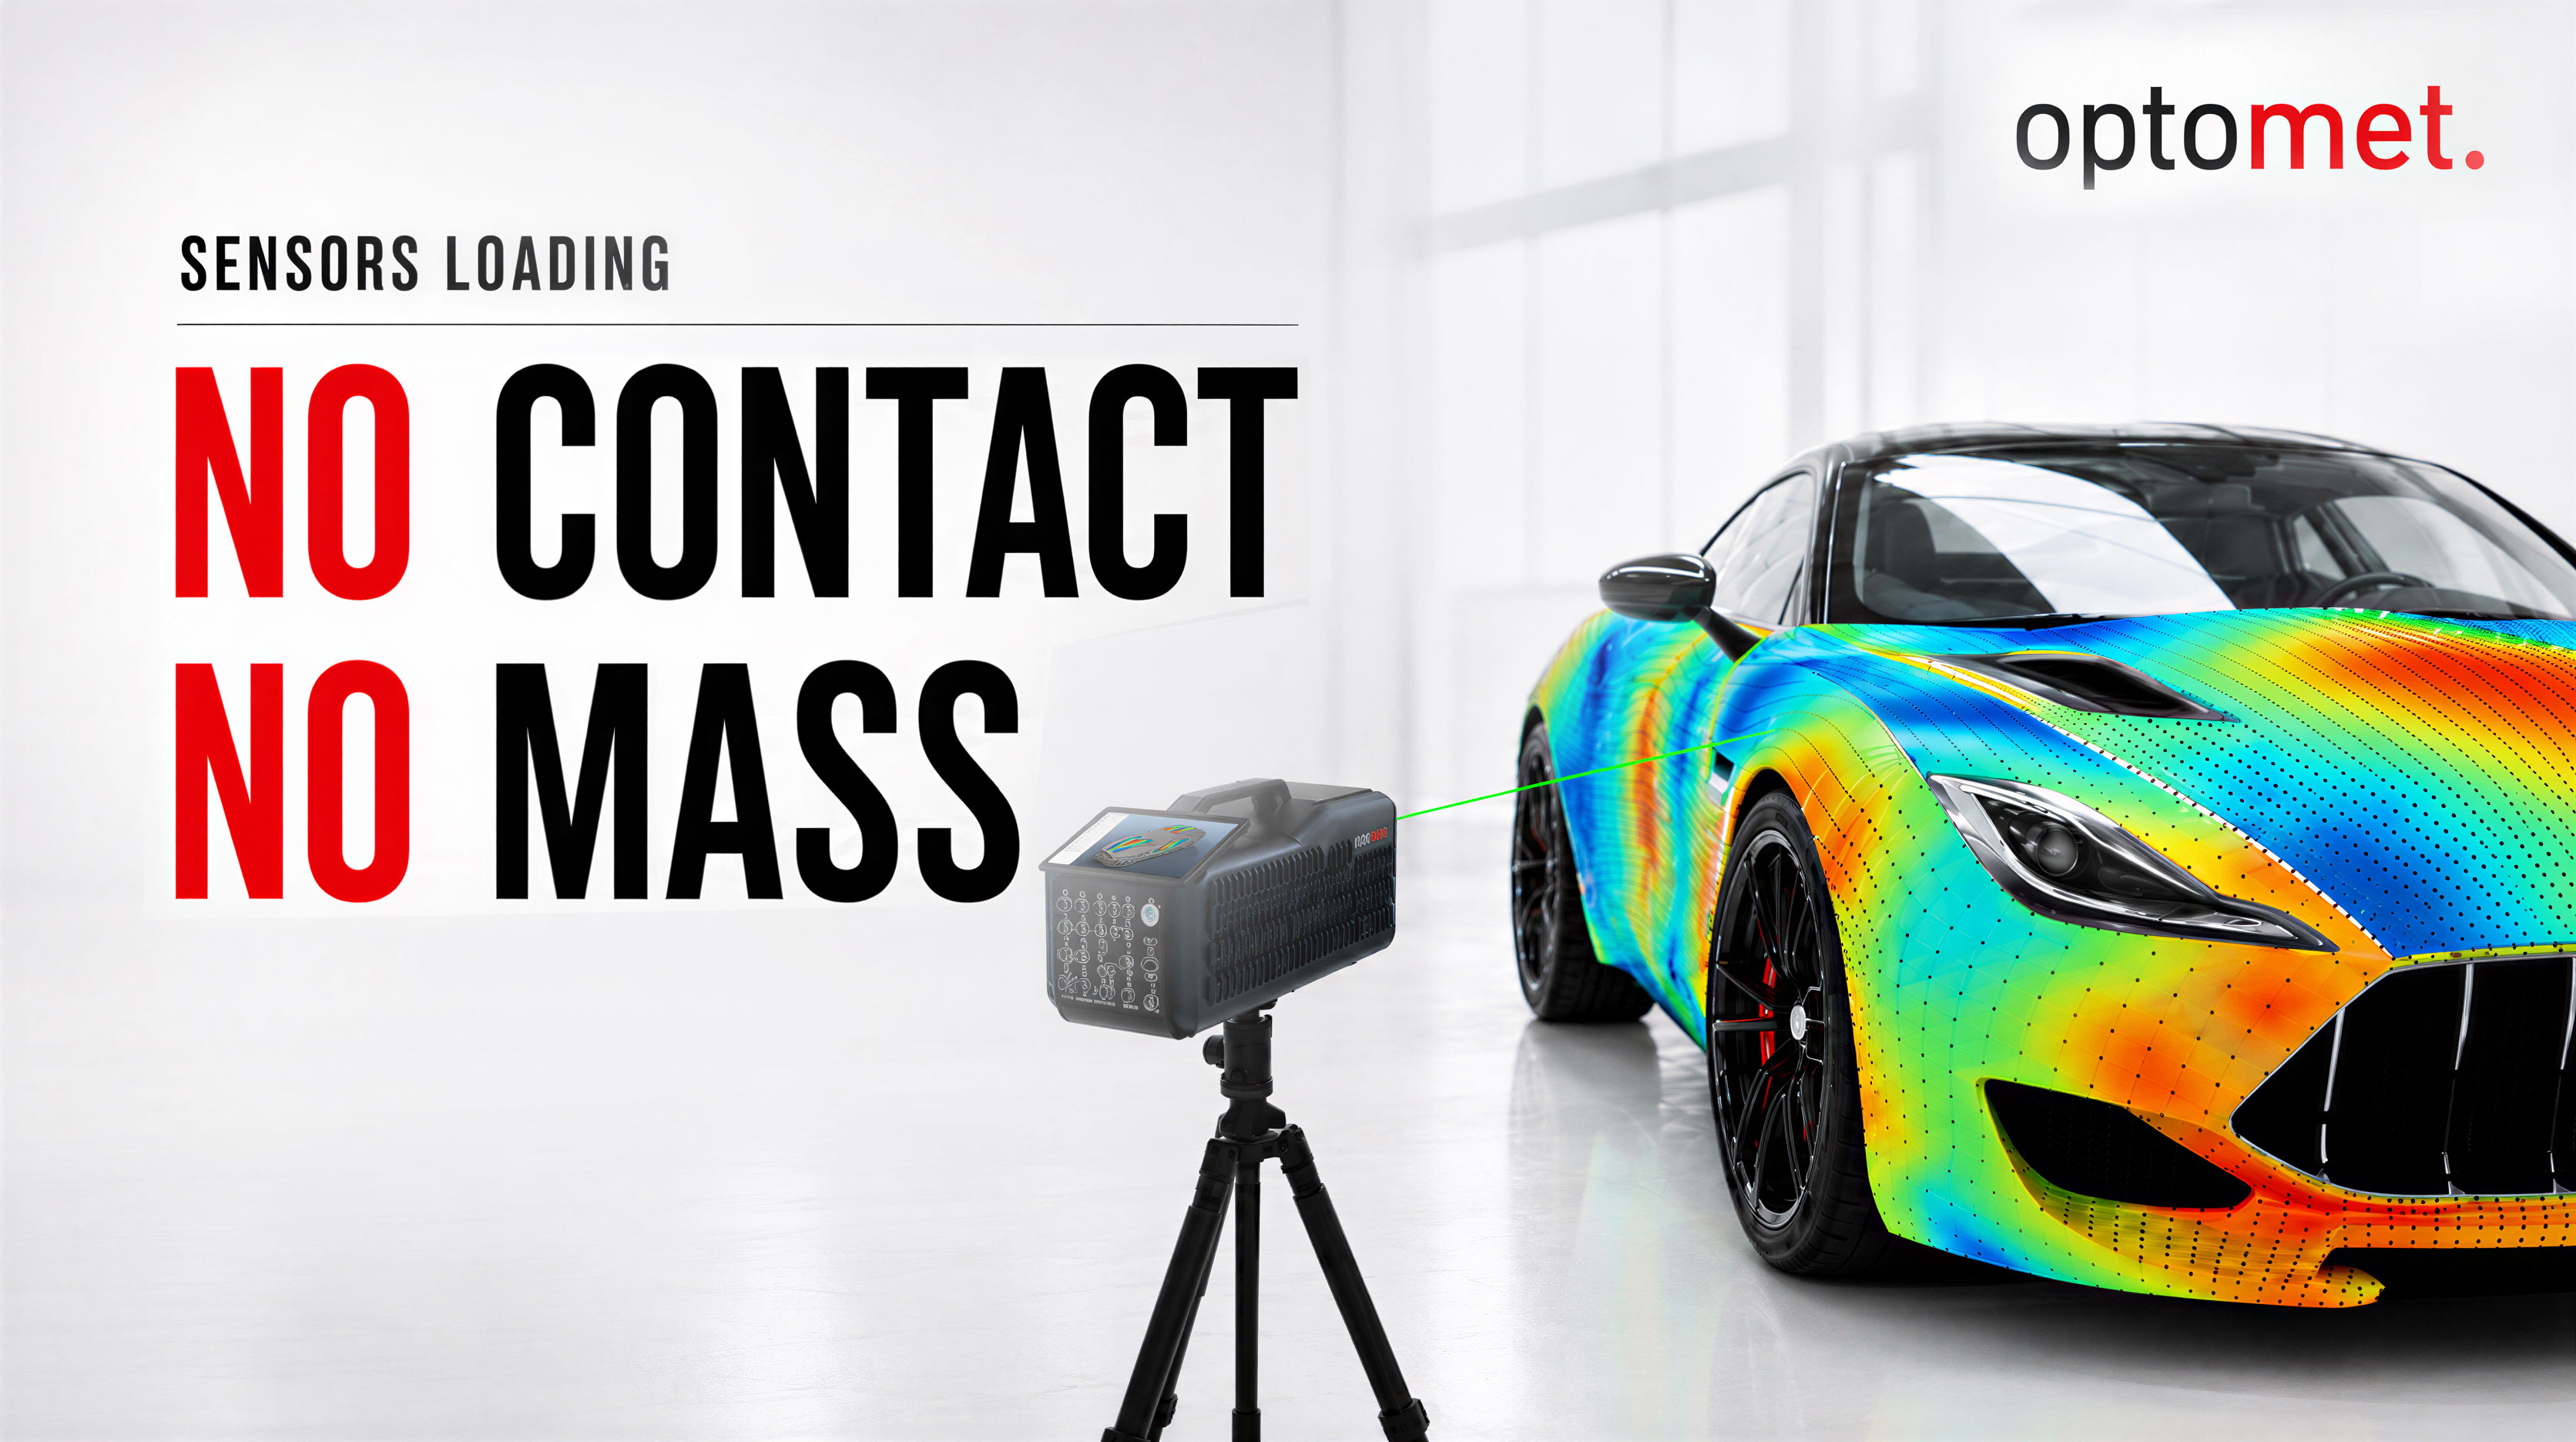
Full-Field Vibration Measurement without Sensors
Multiple SMART Scan+ vibrometers capture the vehicle body non-contact at thousands of measurement points, without adding mass or attaching cables to the object. SMART Lab calibrates all systems within a common 3D reference system, providing full-field visualization of resonances. [2026 | 1:12 min]
Open video page →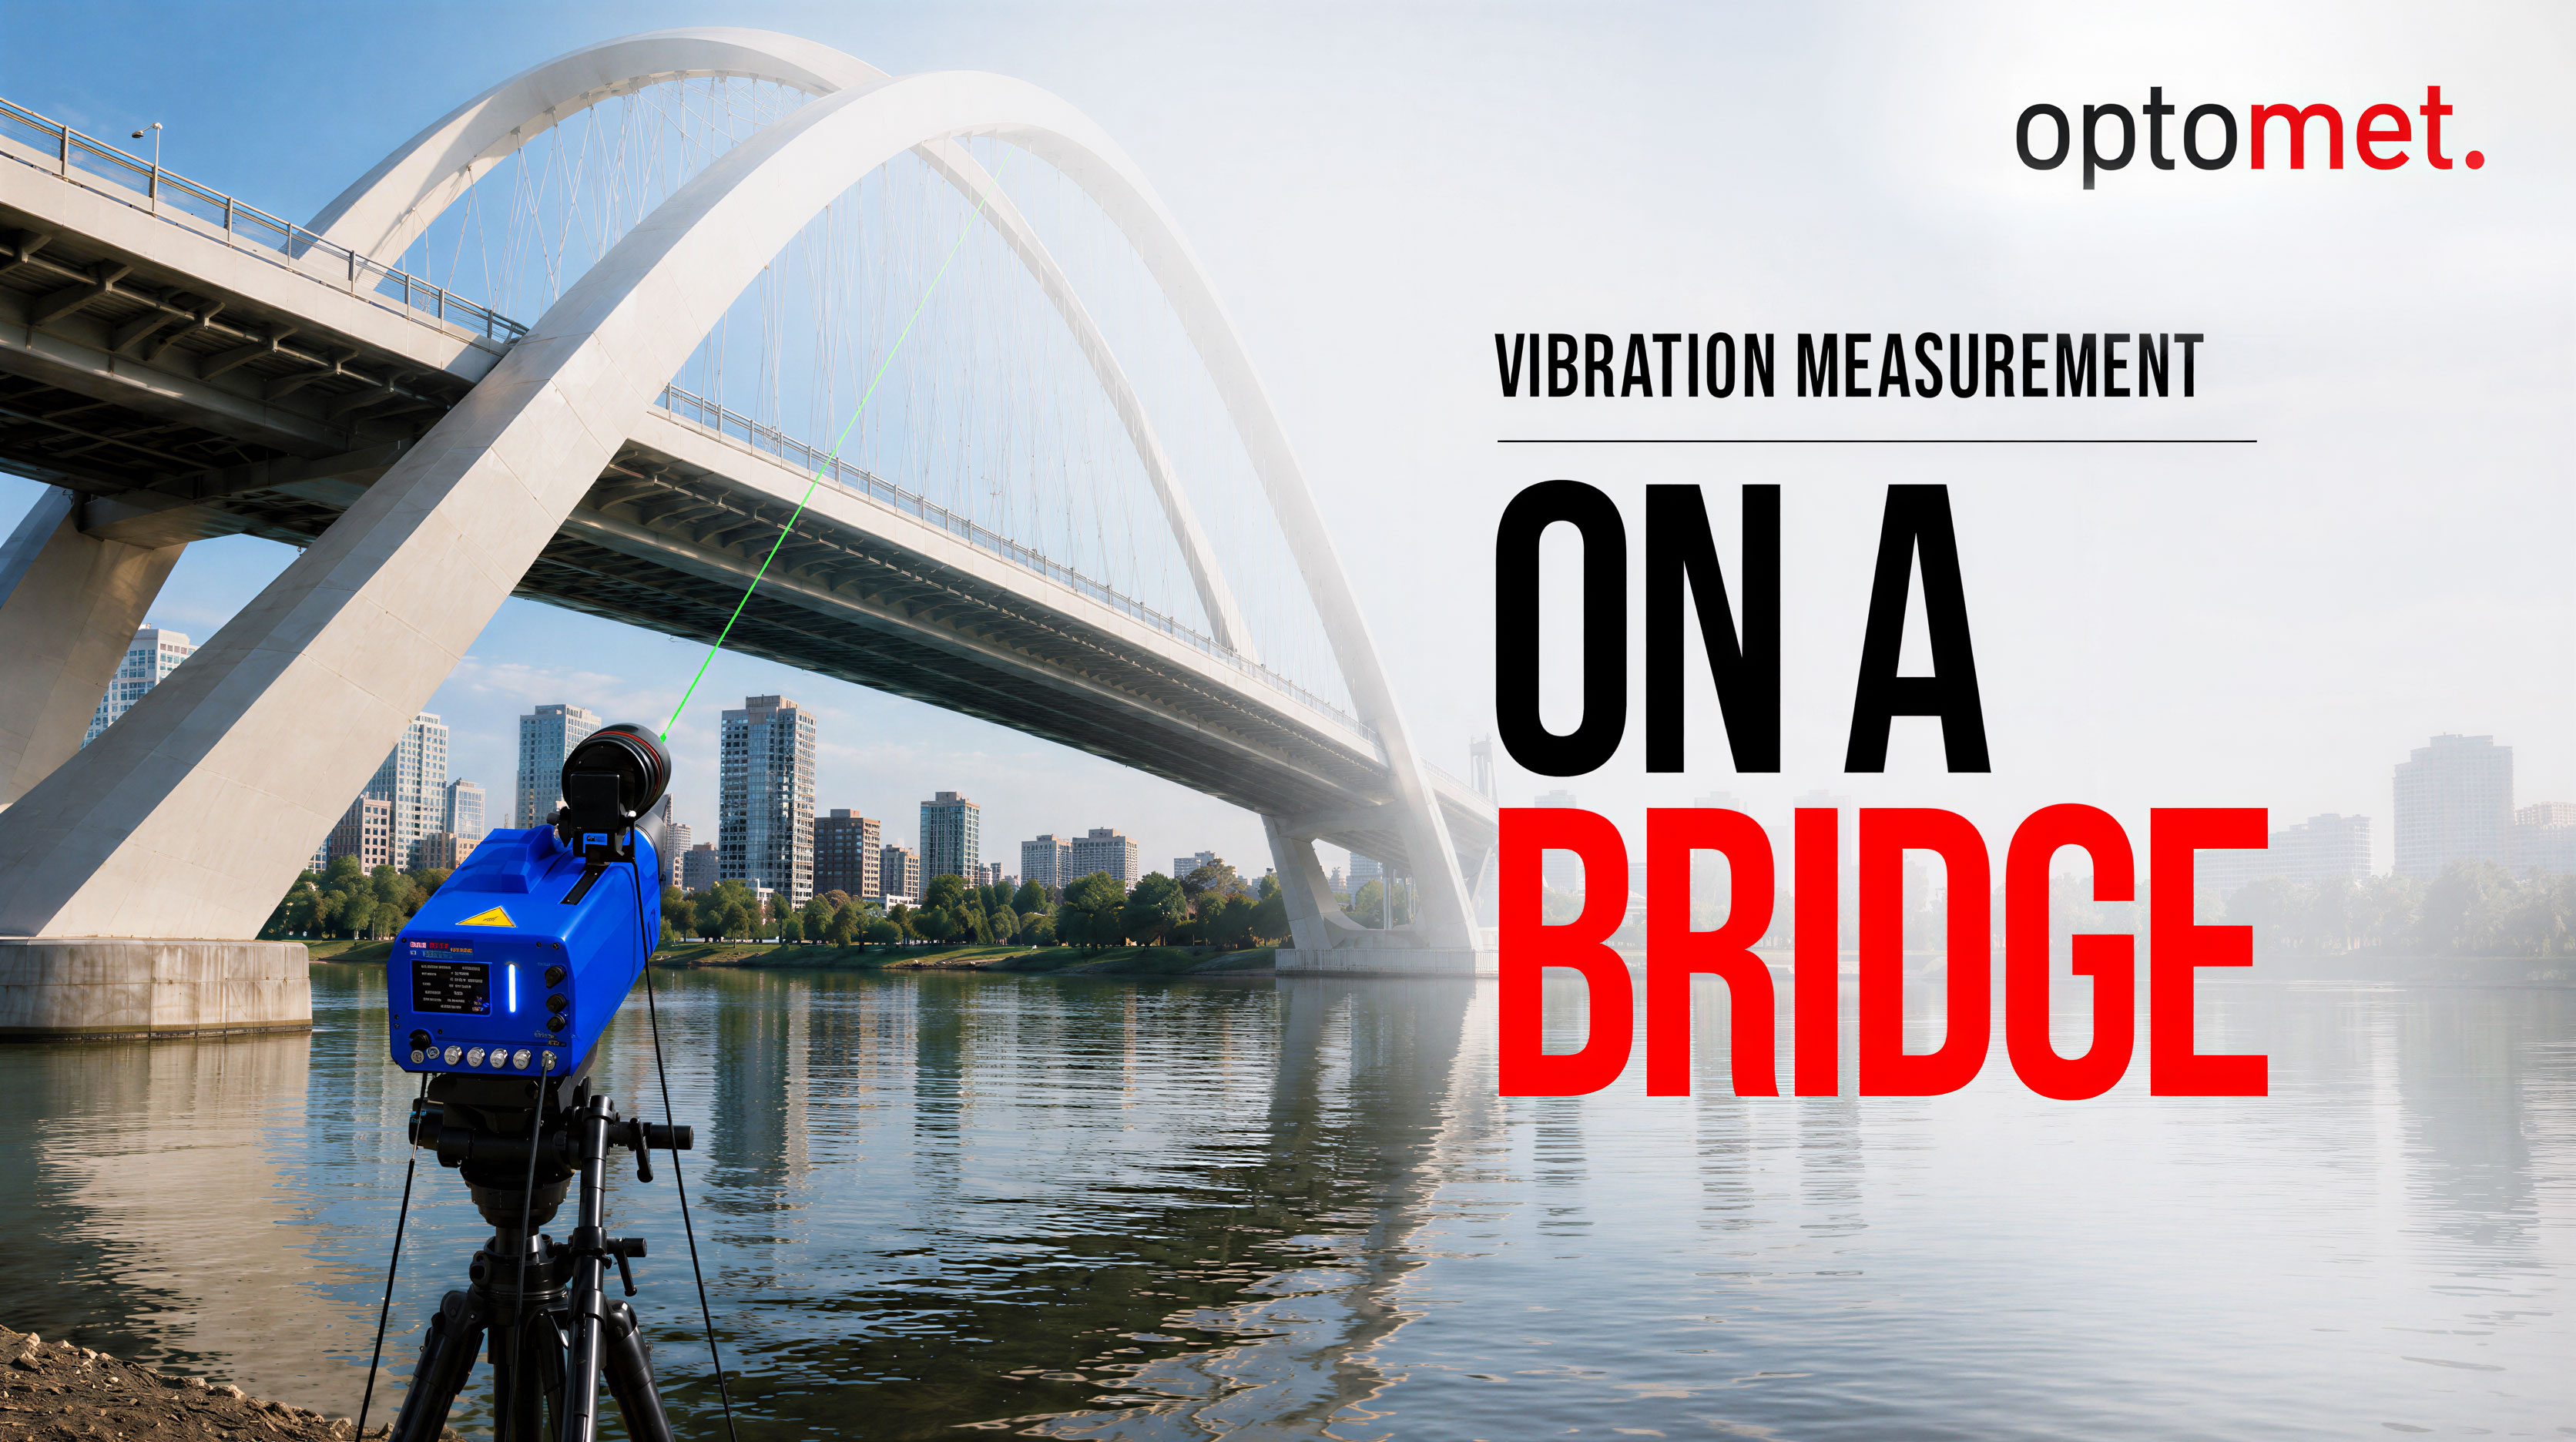
Vibration measurement on a bridge
Vibration measurement on a bridge using the Nova Xtra long-range vibrometer: Thanks to its SWIR laser and integrated infrared camera, non-contact measurements can be performed from distances of up to 300 m without attaching sensors to the structure. [2020| 0:53 min]
Open video page →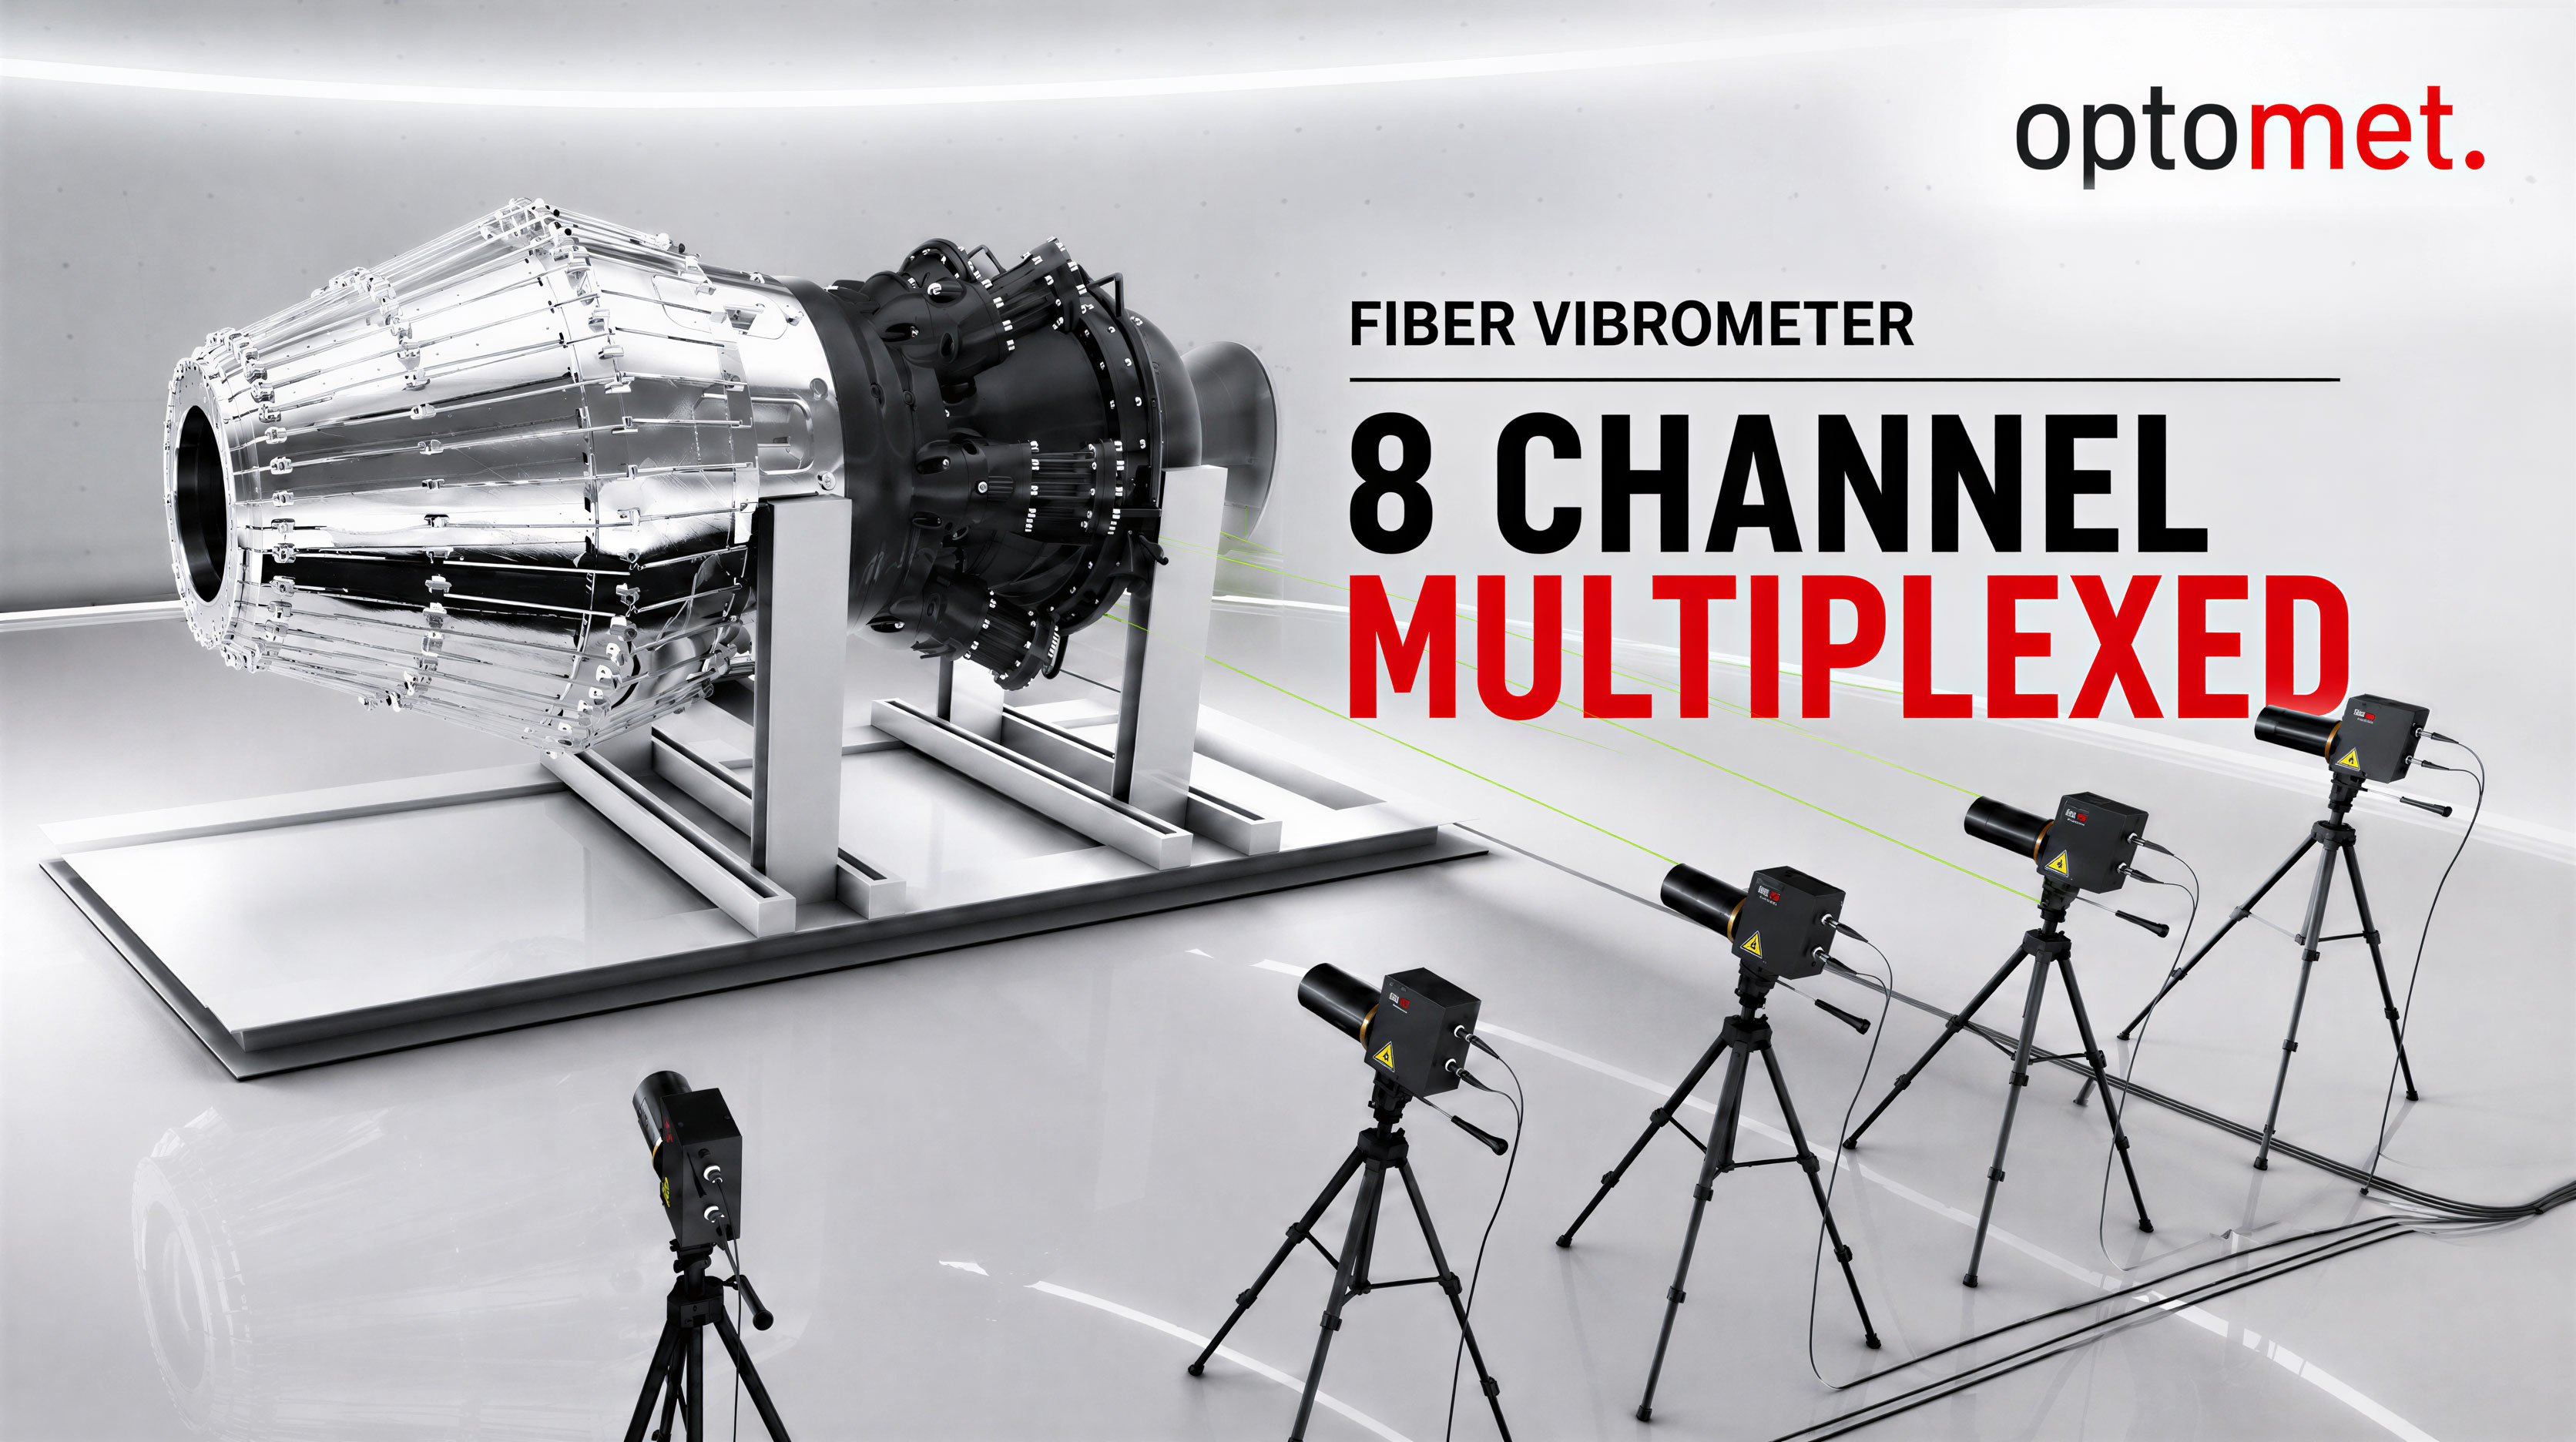
Fiber vibrometer in action
Fiber vibrometer in action: Small passive sensor heads take measurements in hard-to-reach locations, here on an engine in a test stand. A fiber multiplexer enables switching between multiple sensor heads and measuring objects from different directions. [2018 | 0:28 min]
Open video page →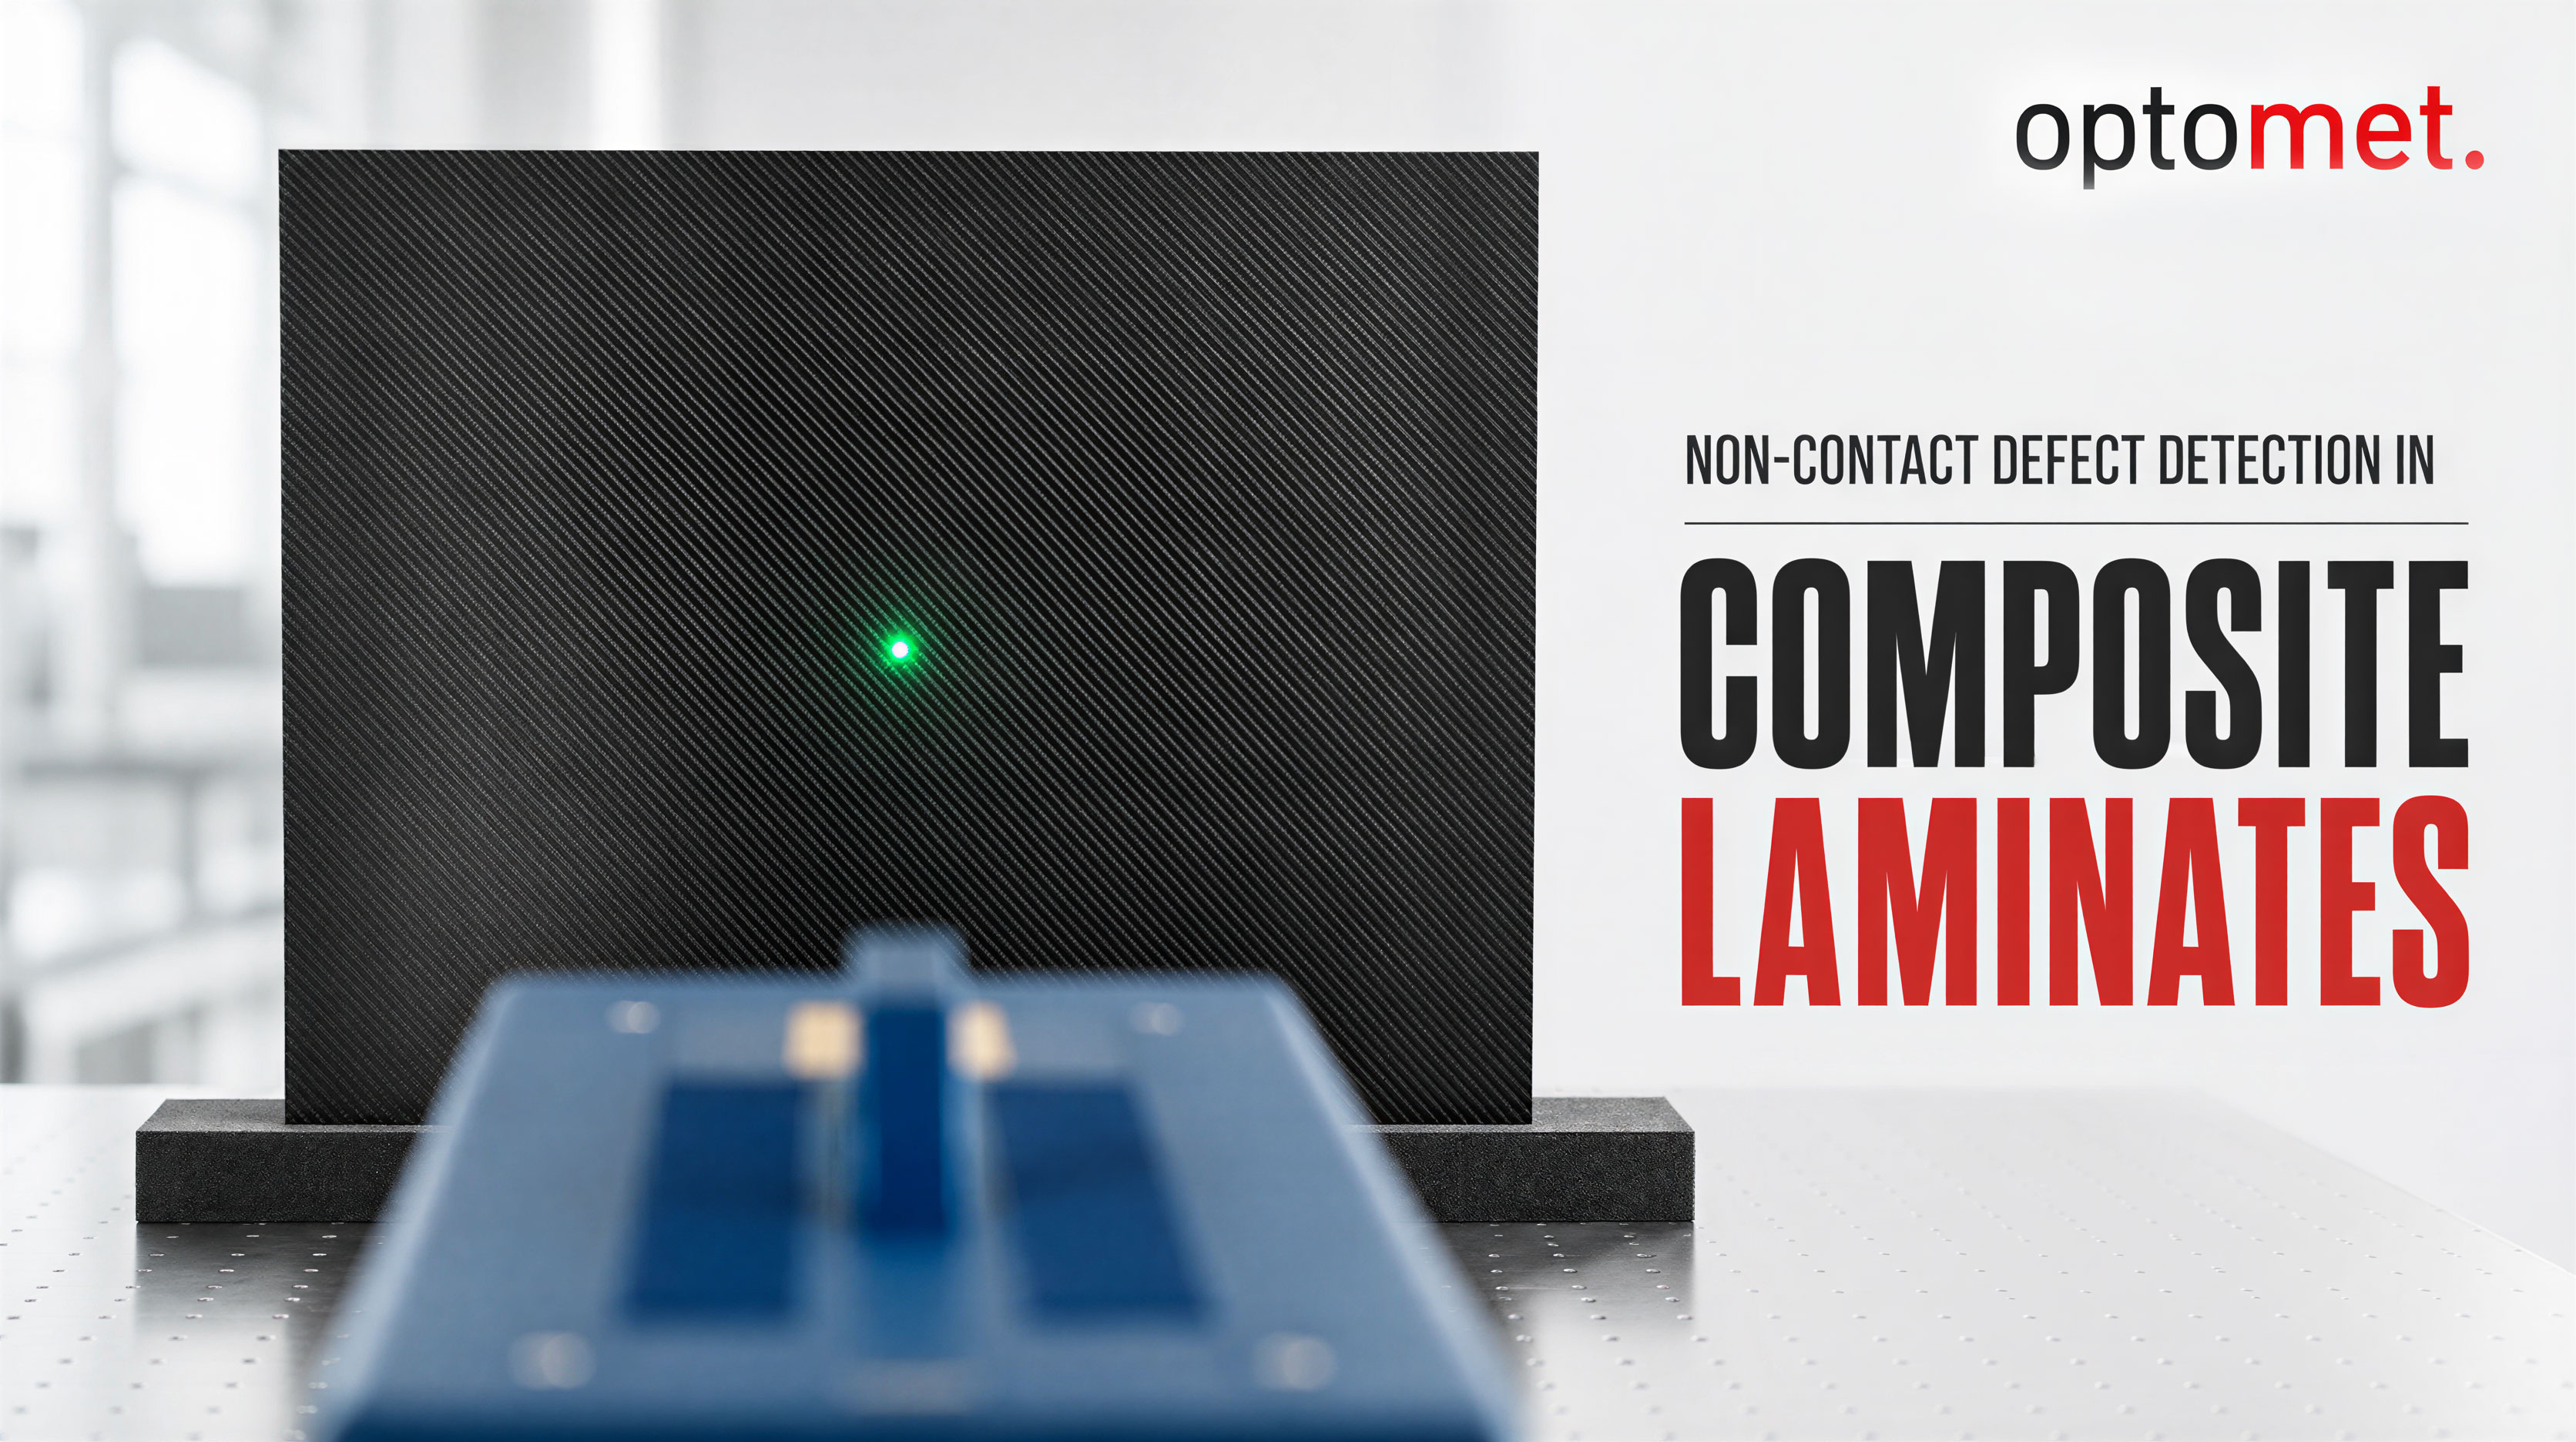
Non-Contact Defect Detection in Composite Laminates
Non-destructive testing of a CFRP panel: A piezo actuator excites guided waves, and the SWIR scanning vibrometer captures their propagation across the entire surface. The wave field changes at discontinuities, allowing defects to be located without contact. [2019| 1:45 min]
Open video page →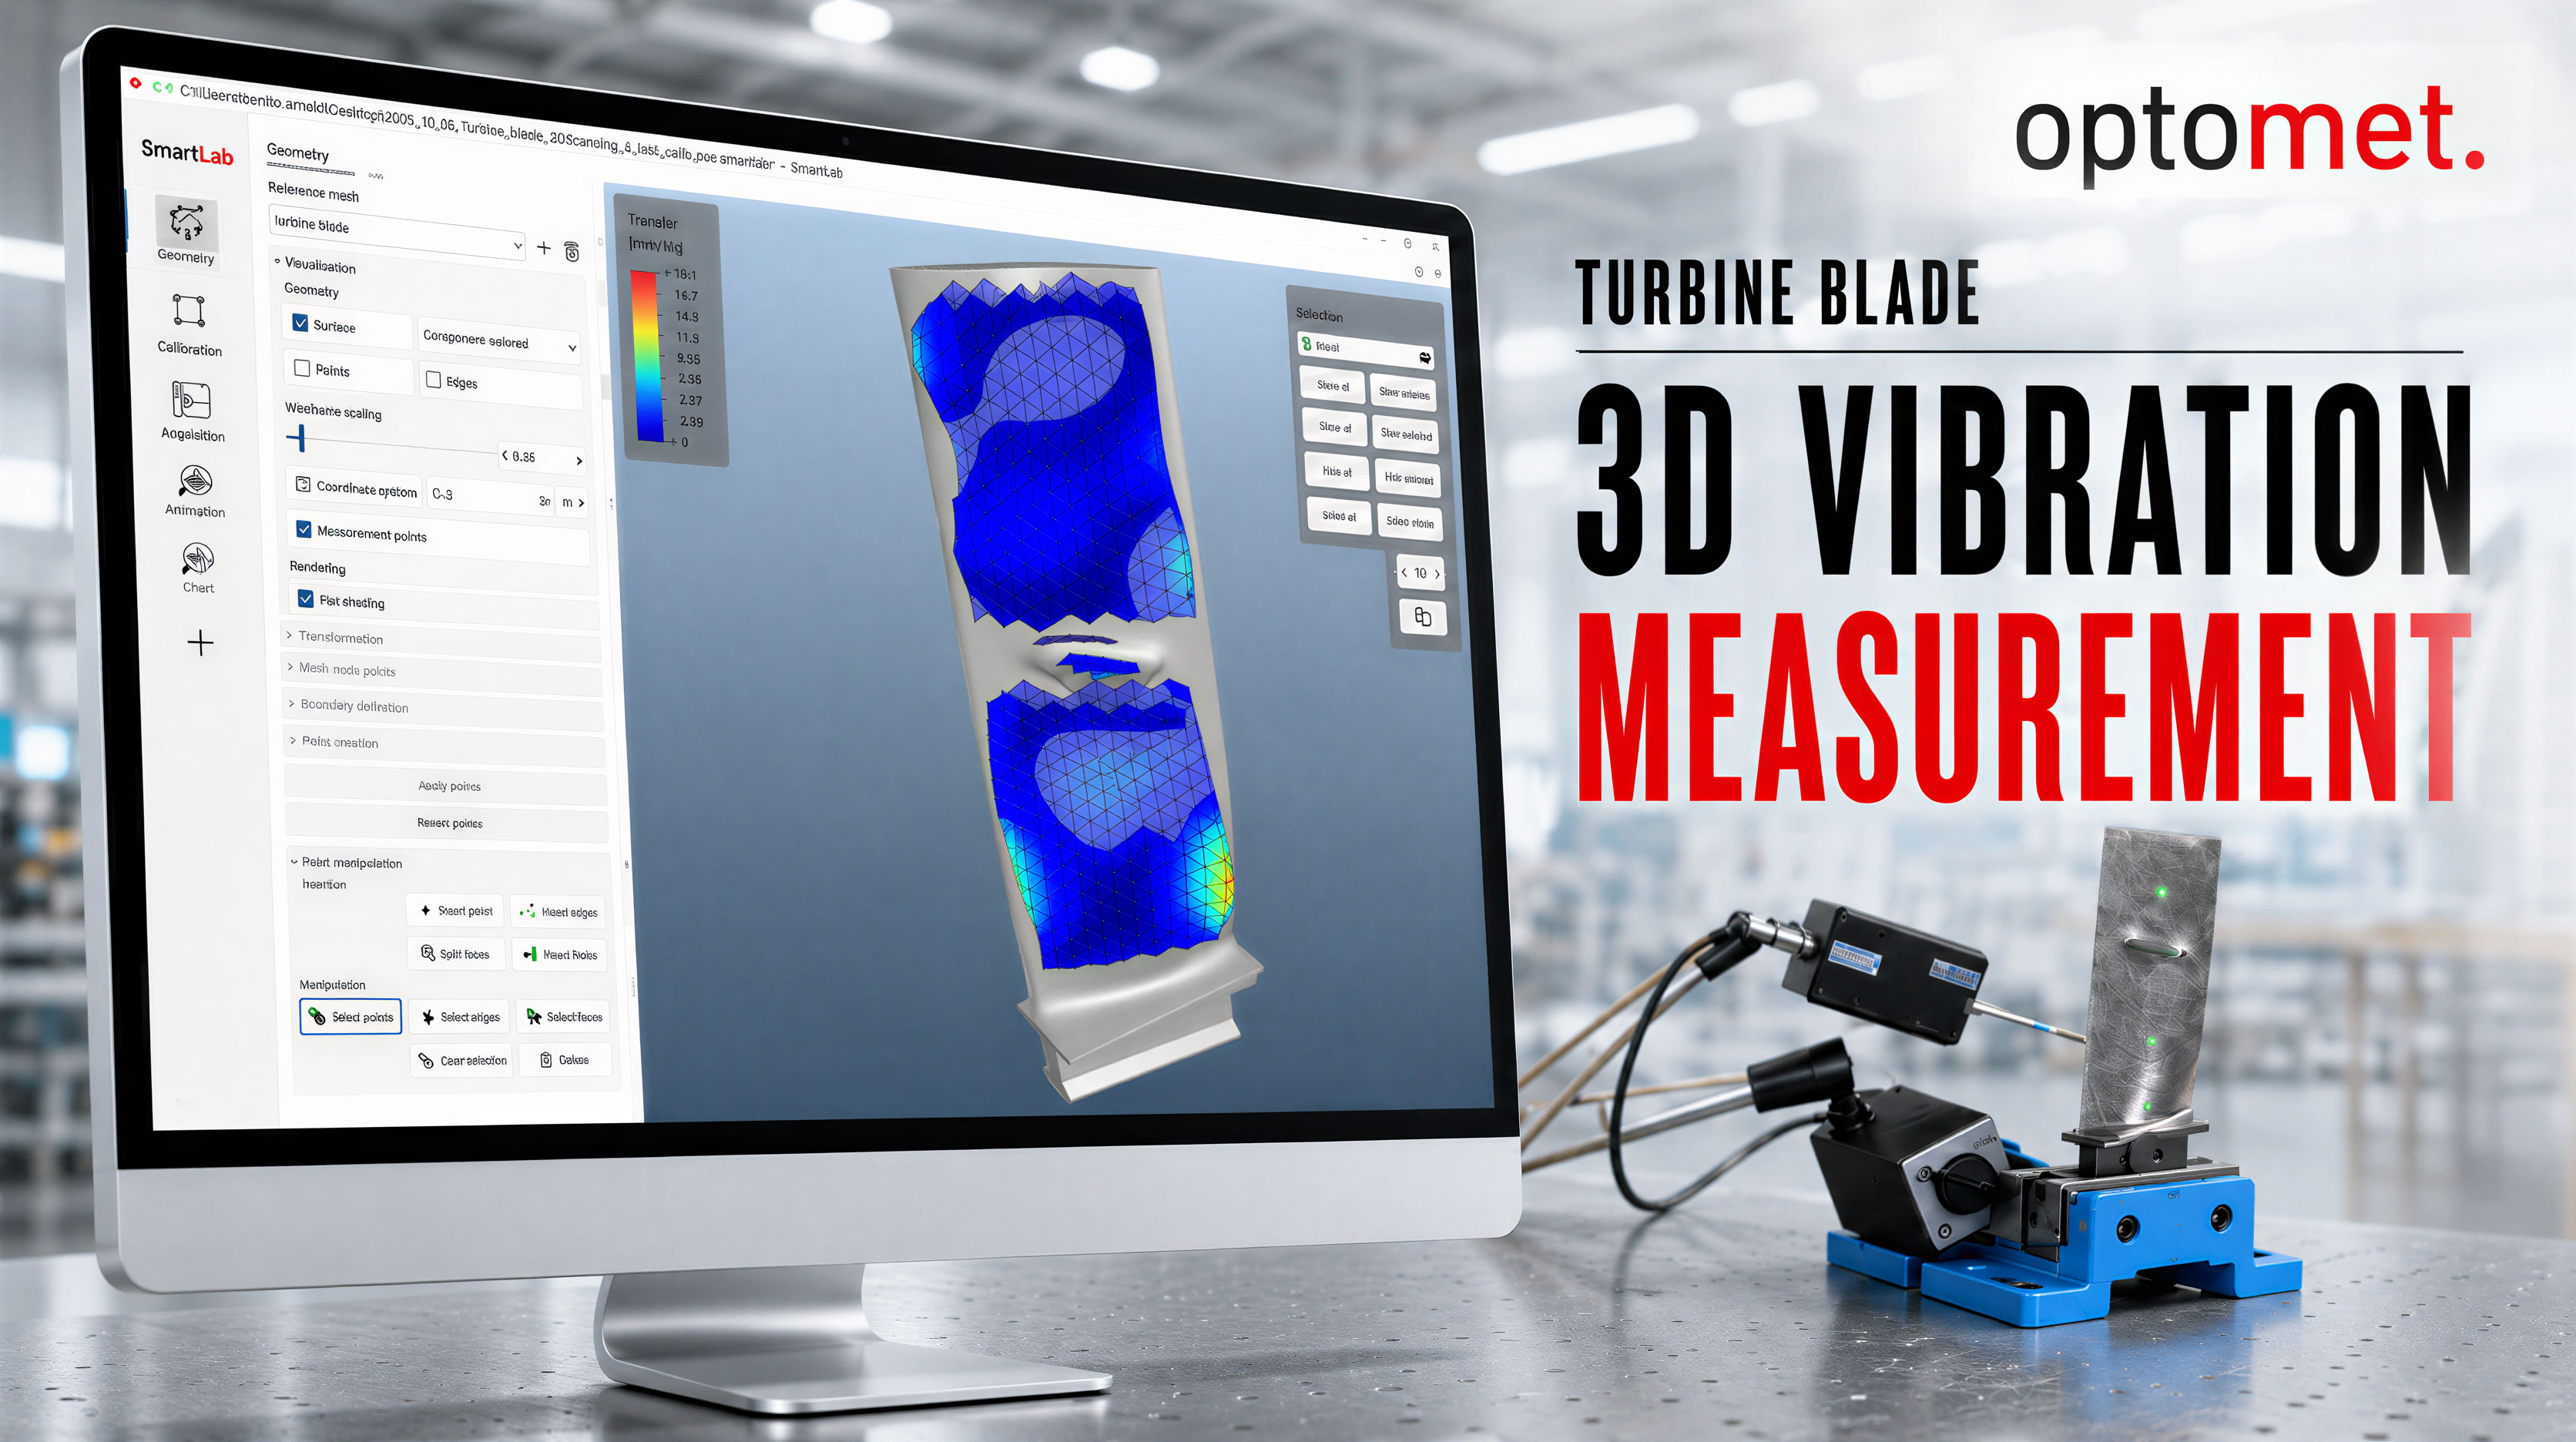
3D Vibration Measurement of a Turbine Blade
3D vibration measurement of a turbine blade using the SMART 3D system: automated modal hammer, measurement points distributed around the entire blade, and automatic calibration to the digital twin. Out-of-plane and in-plane modes are captured with high precision. [2025 | 0:52 min]
Open video page →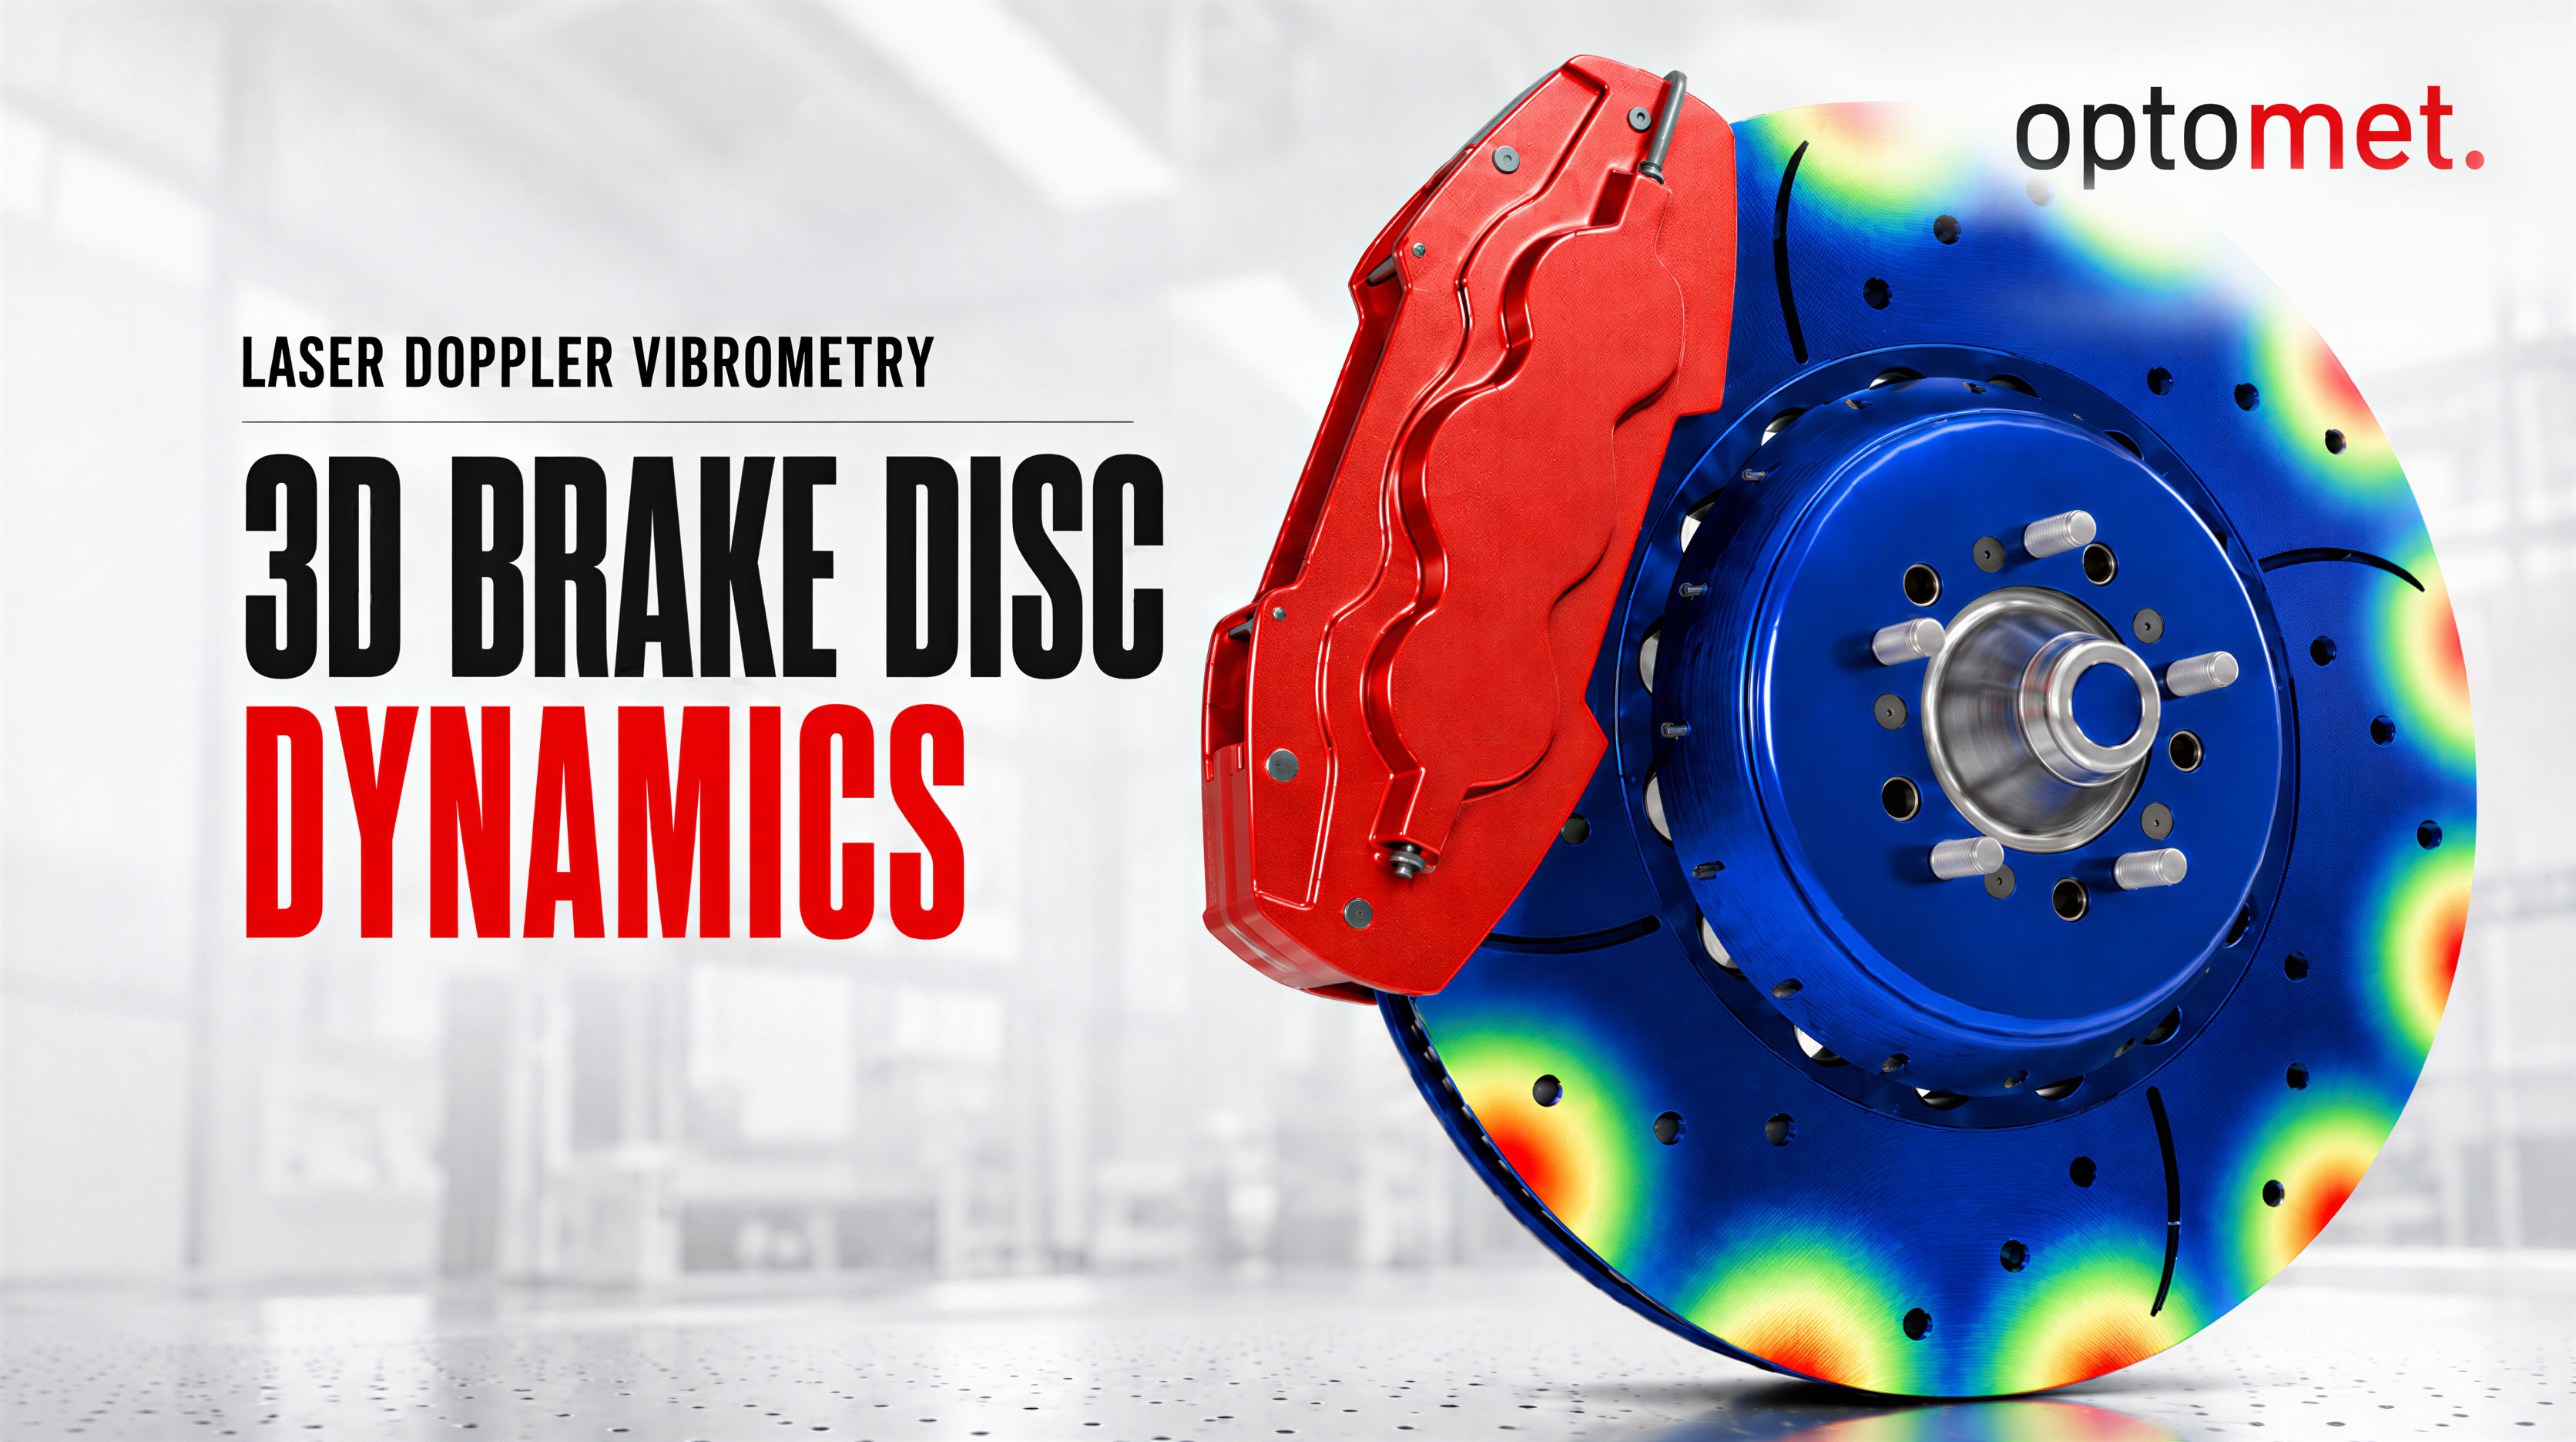
3D Brake Disc Dynamics with Laser Doppler Vibrometry
3D scanning vibrometry on a brake disc: Three vibrometers perform non-contact measurements in all spatial directions without adding mass. From geometry import to operational deflection shape analysis, SmartLab delivers reliable 3D data for development. [2025 | 1:05 min]
Open video page →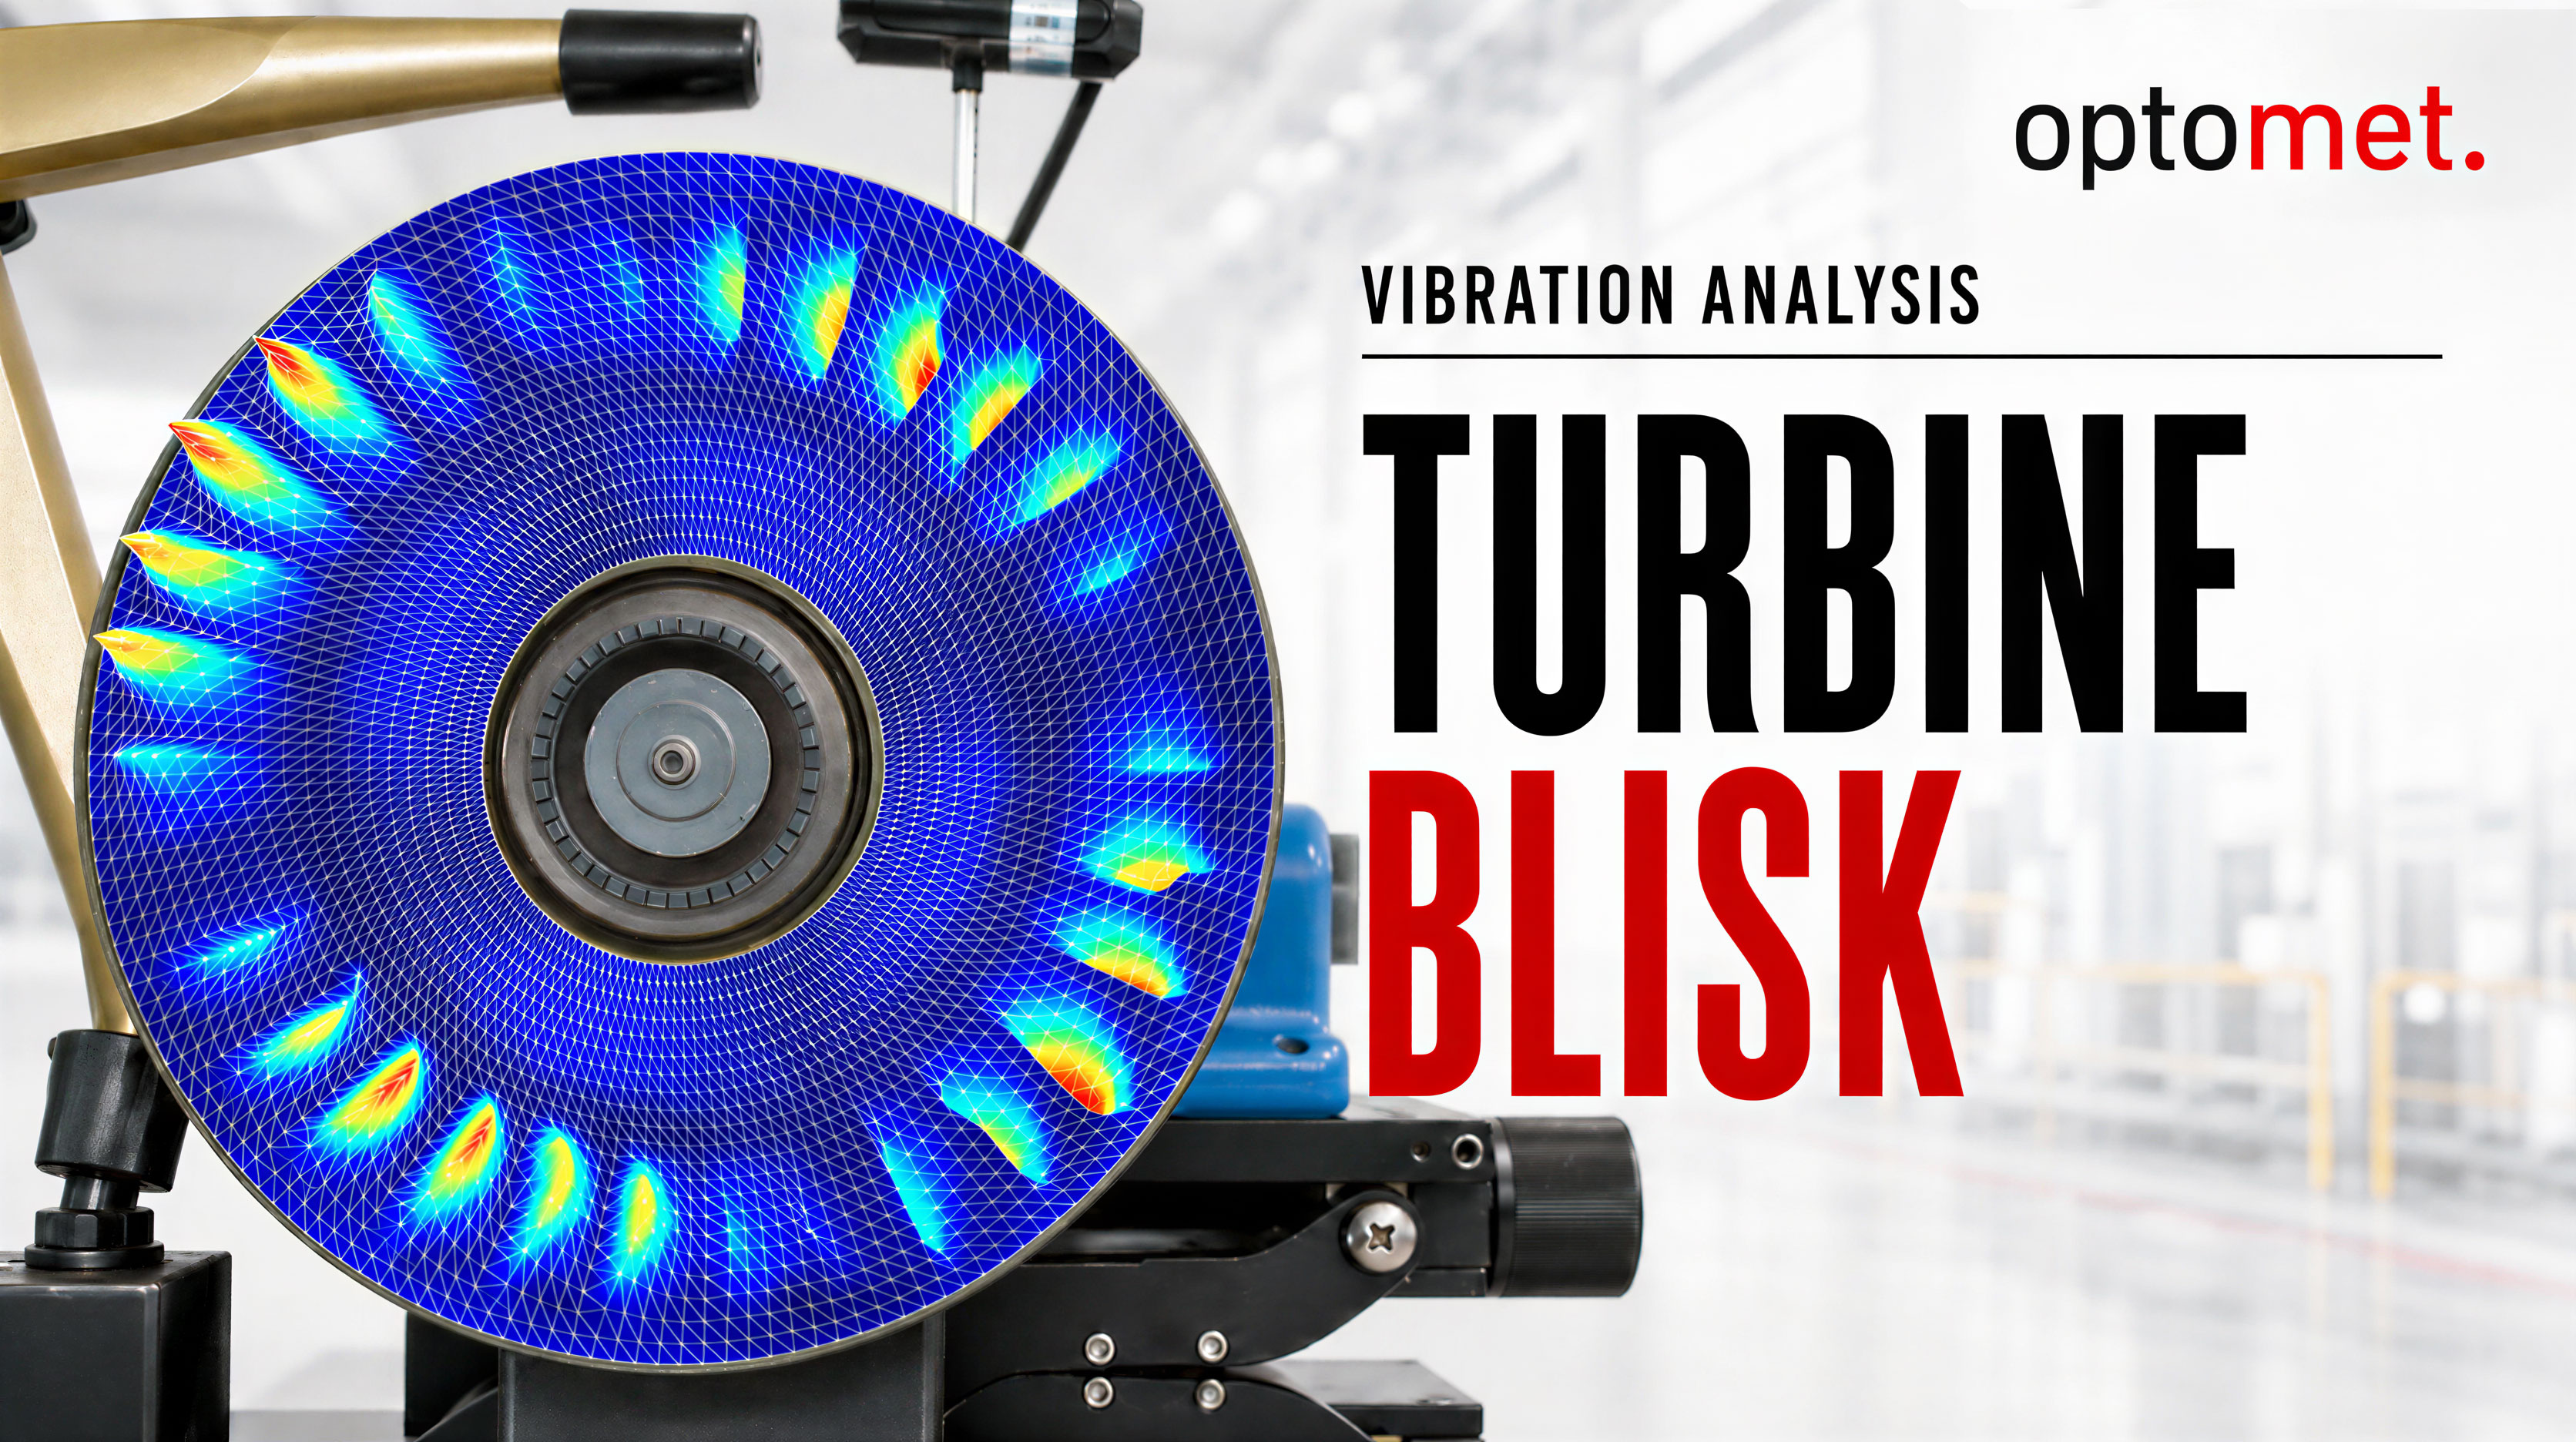
Modal Analysis of a Turbine Blisk
Vibration analysis of a turbine blisk: An automated impact hammer excites the component, while the scanning vibrometer captures its response. The video shows live measurement, mode shapes, and data export." [2022 | 2:24 min]
Open video page →3D vibration measurement on a turbine blade
Operational deflection shapes of a turbine blade: The blade excited on the shaker is scanned across its entire surface using the SWIR scanning vibrometer. The software displays the deflection shapes at frequencies ranging from 78.5 Hz to 8.2 kHz. [2025 | 1:28 min]
Open video page →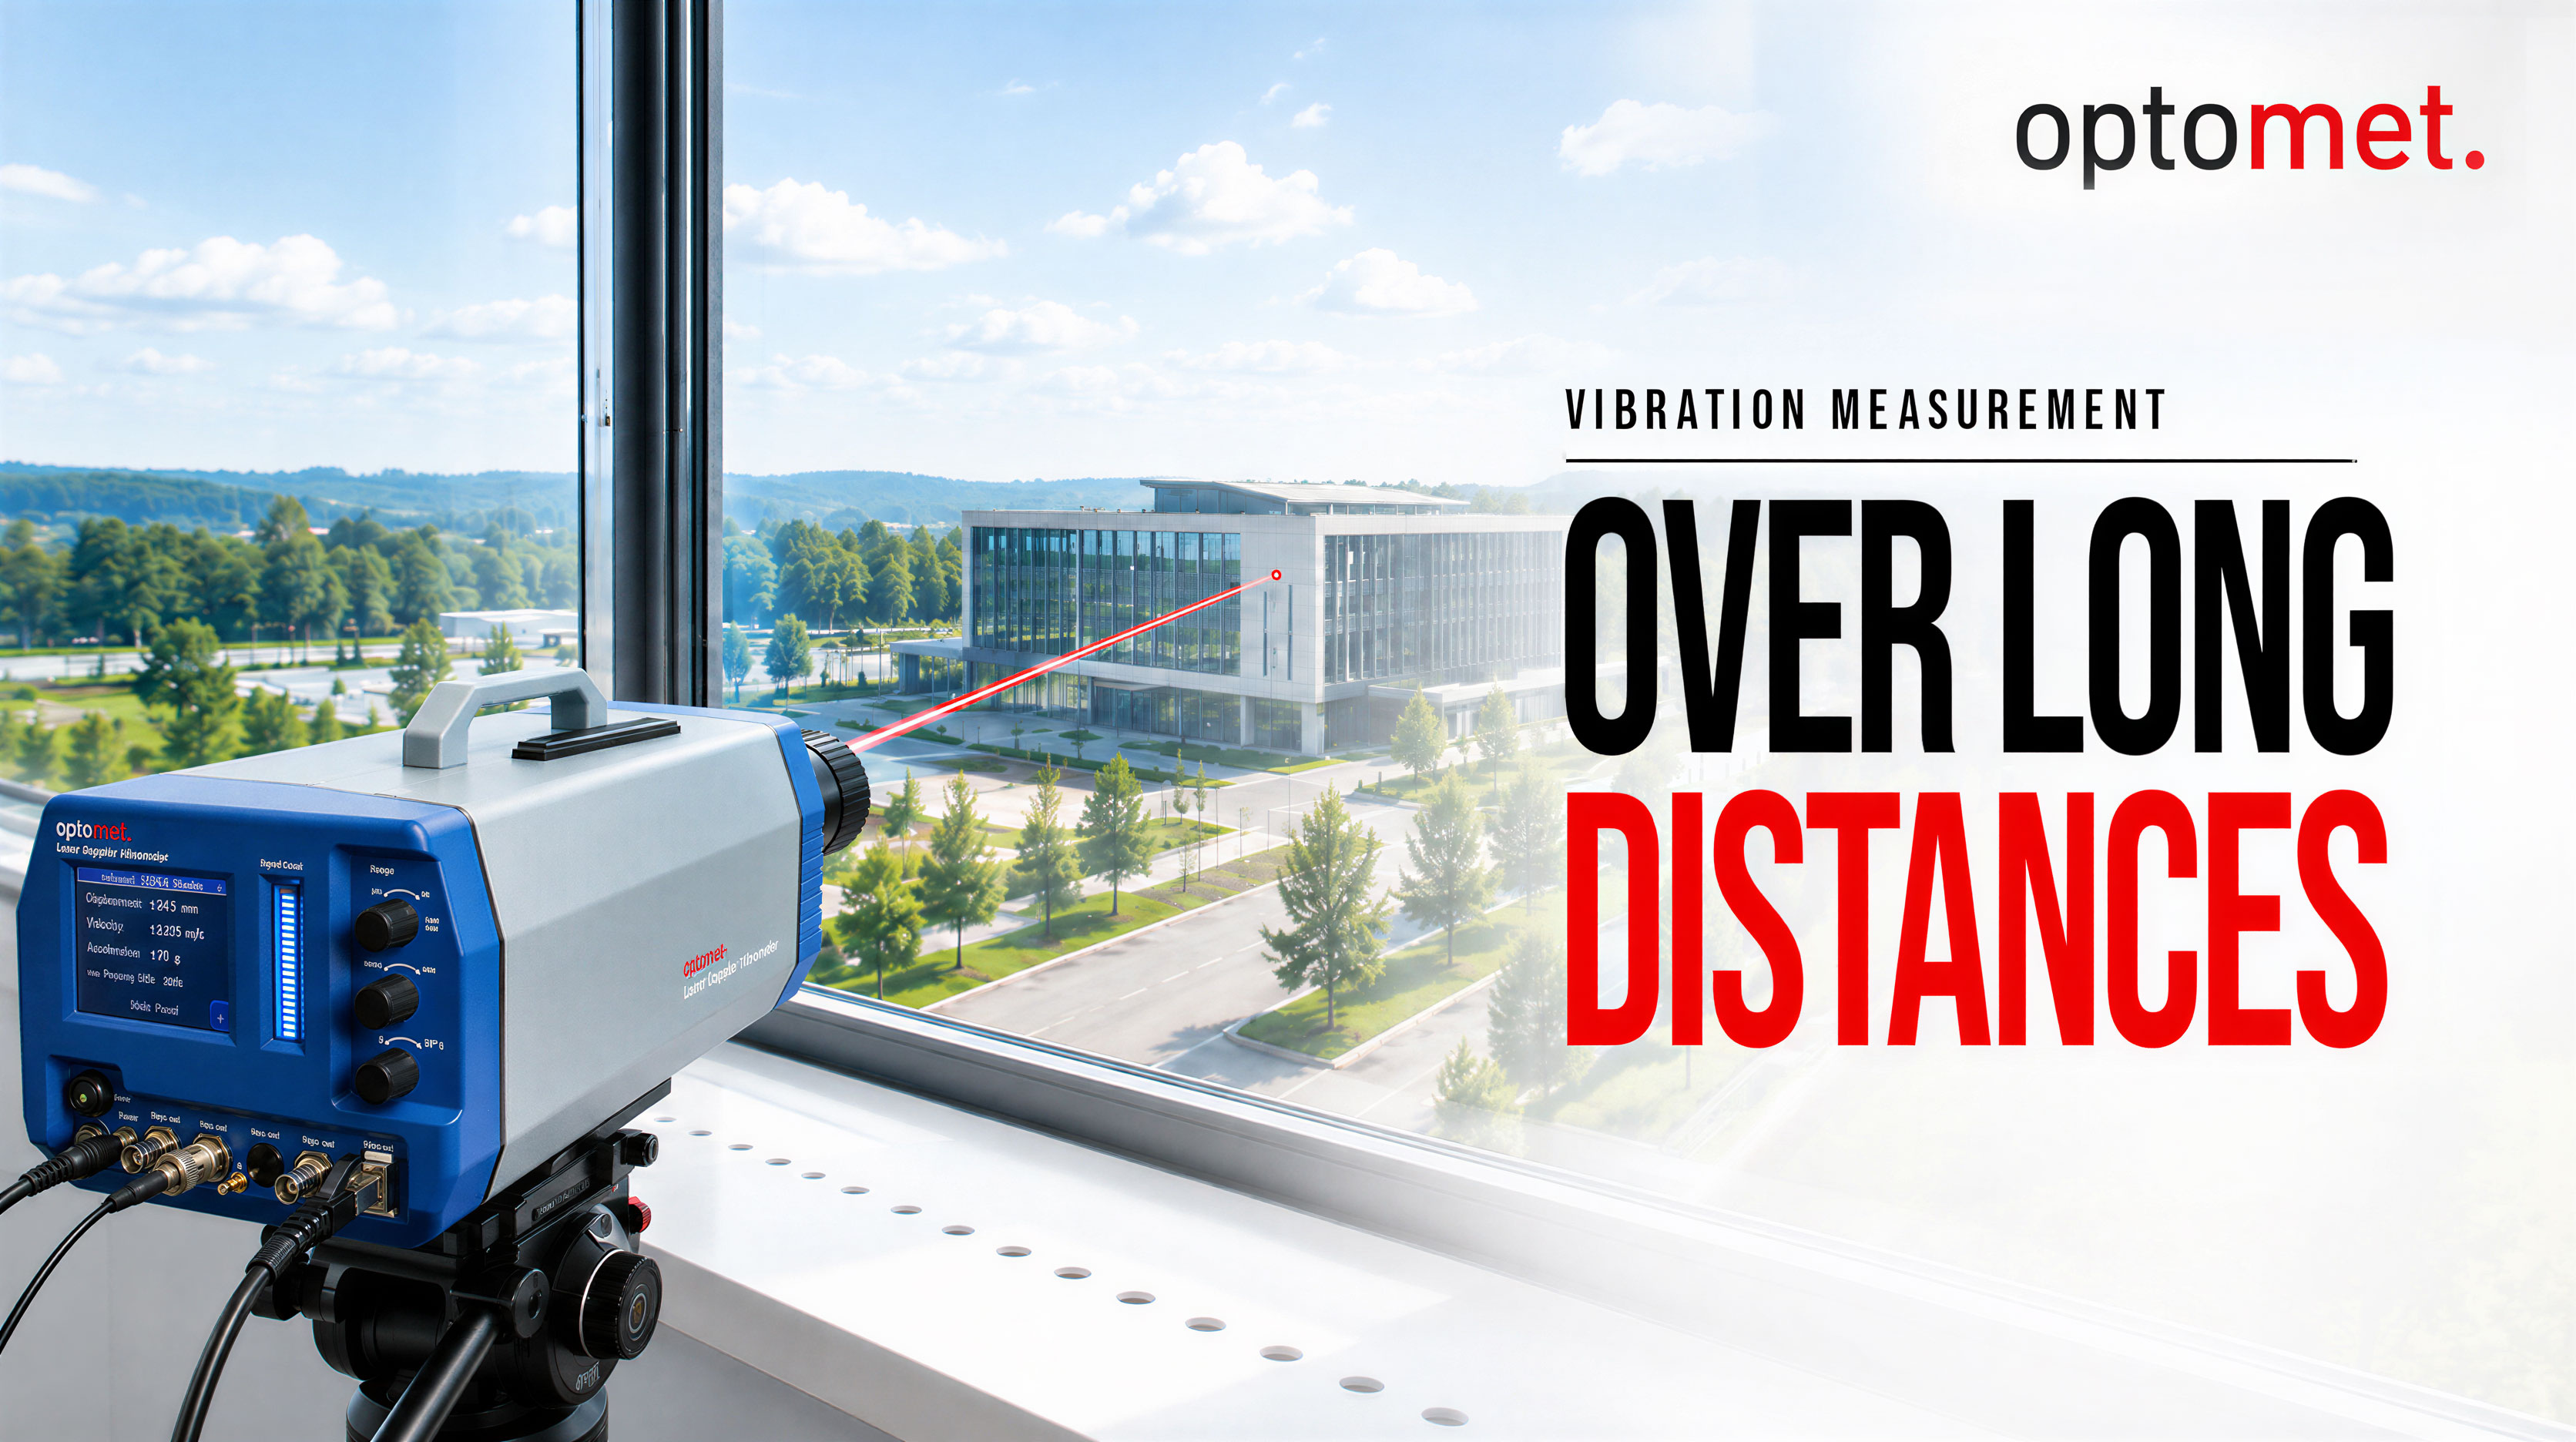
Vibration measurement over long distances
Practical demonstration of remote measurement: From a position by the window, the vibrometer measures a distant outdoor target, with the live signal appearing instantly on the laptop. Non-contact vibration measurement works even over long distances. [2018| 0:32 min]
Open video page →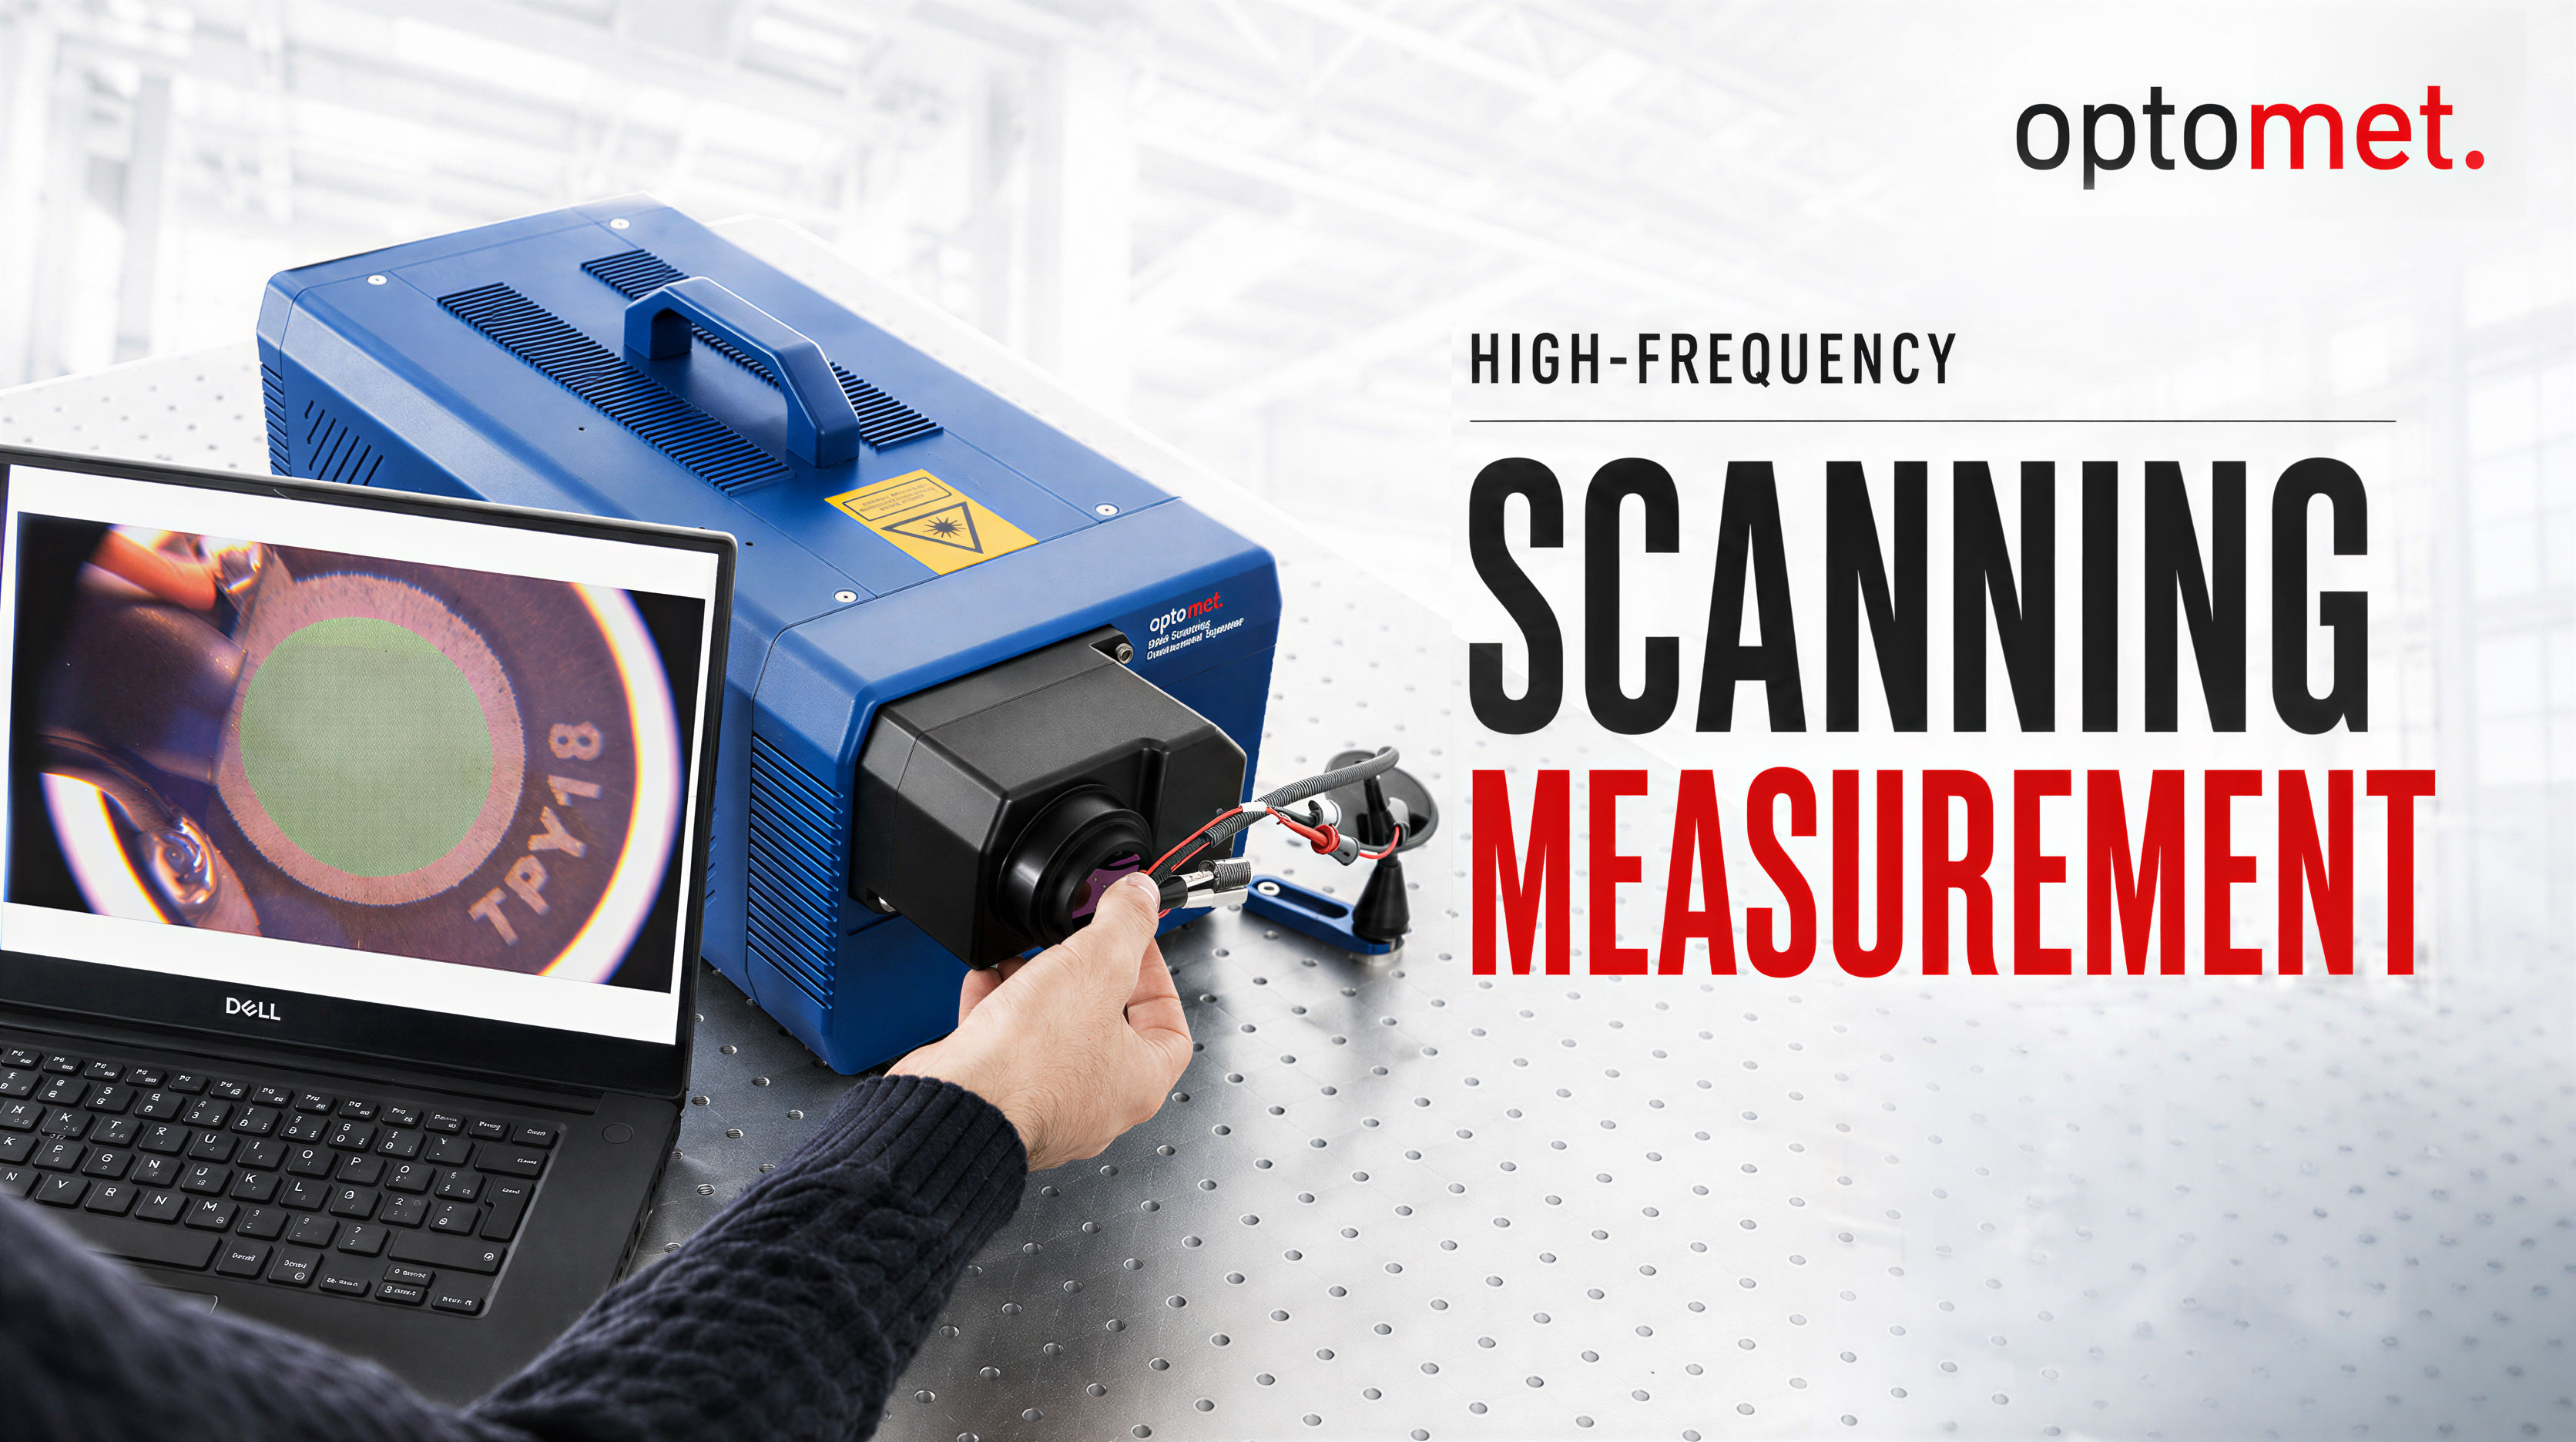
High-frequency scanning measurement
High-frequency scanning of a piezo buzzer: Equipped with the close-up unit, the all-in-one scanning vibrometer measures even the smallest structures. The scans reveal mode shapes at 1.77 MHz and 4.44 MHz, relevant to ultrasonic applications. [2020 | 1:08 min]
Open video page →
Vibrations of a rough, rotating grinding wheel
Operating deflection shapes of a rough, rotating grinding wheel at 5,800 rpm: Despite the dark surface and rotation, the vibrometer measures without contact. Shown: deflection shapes at the rotational frequency and its harmonics. [2020| 1:10 min]
Open video page →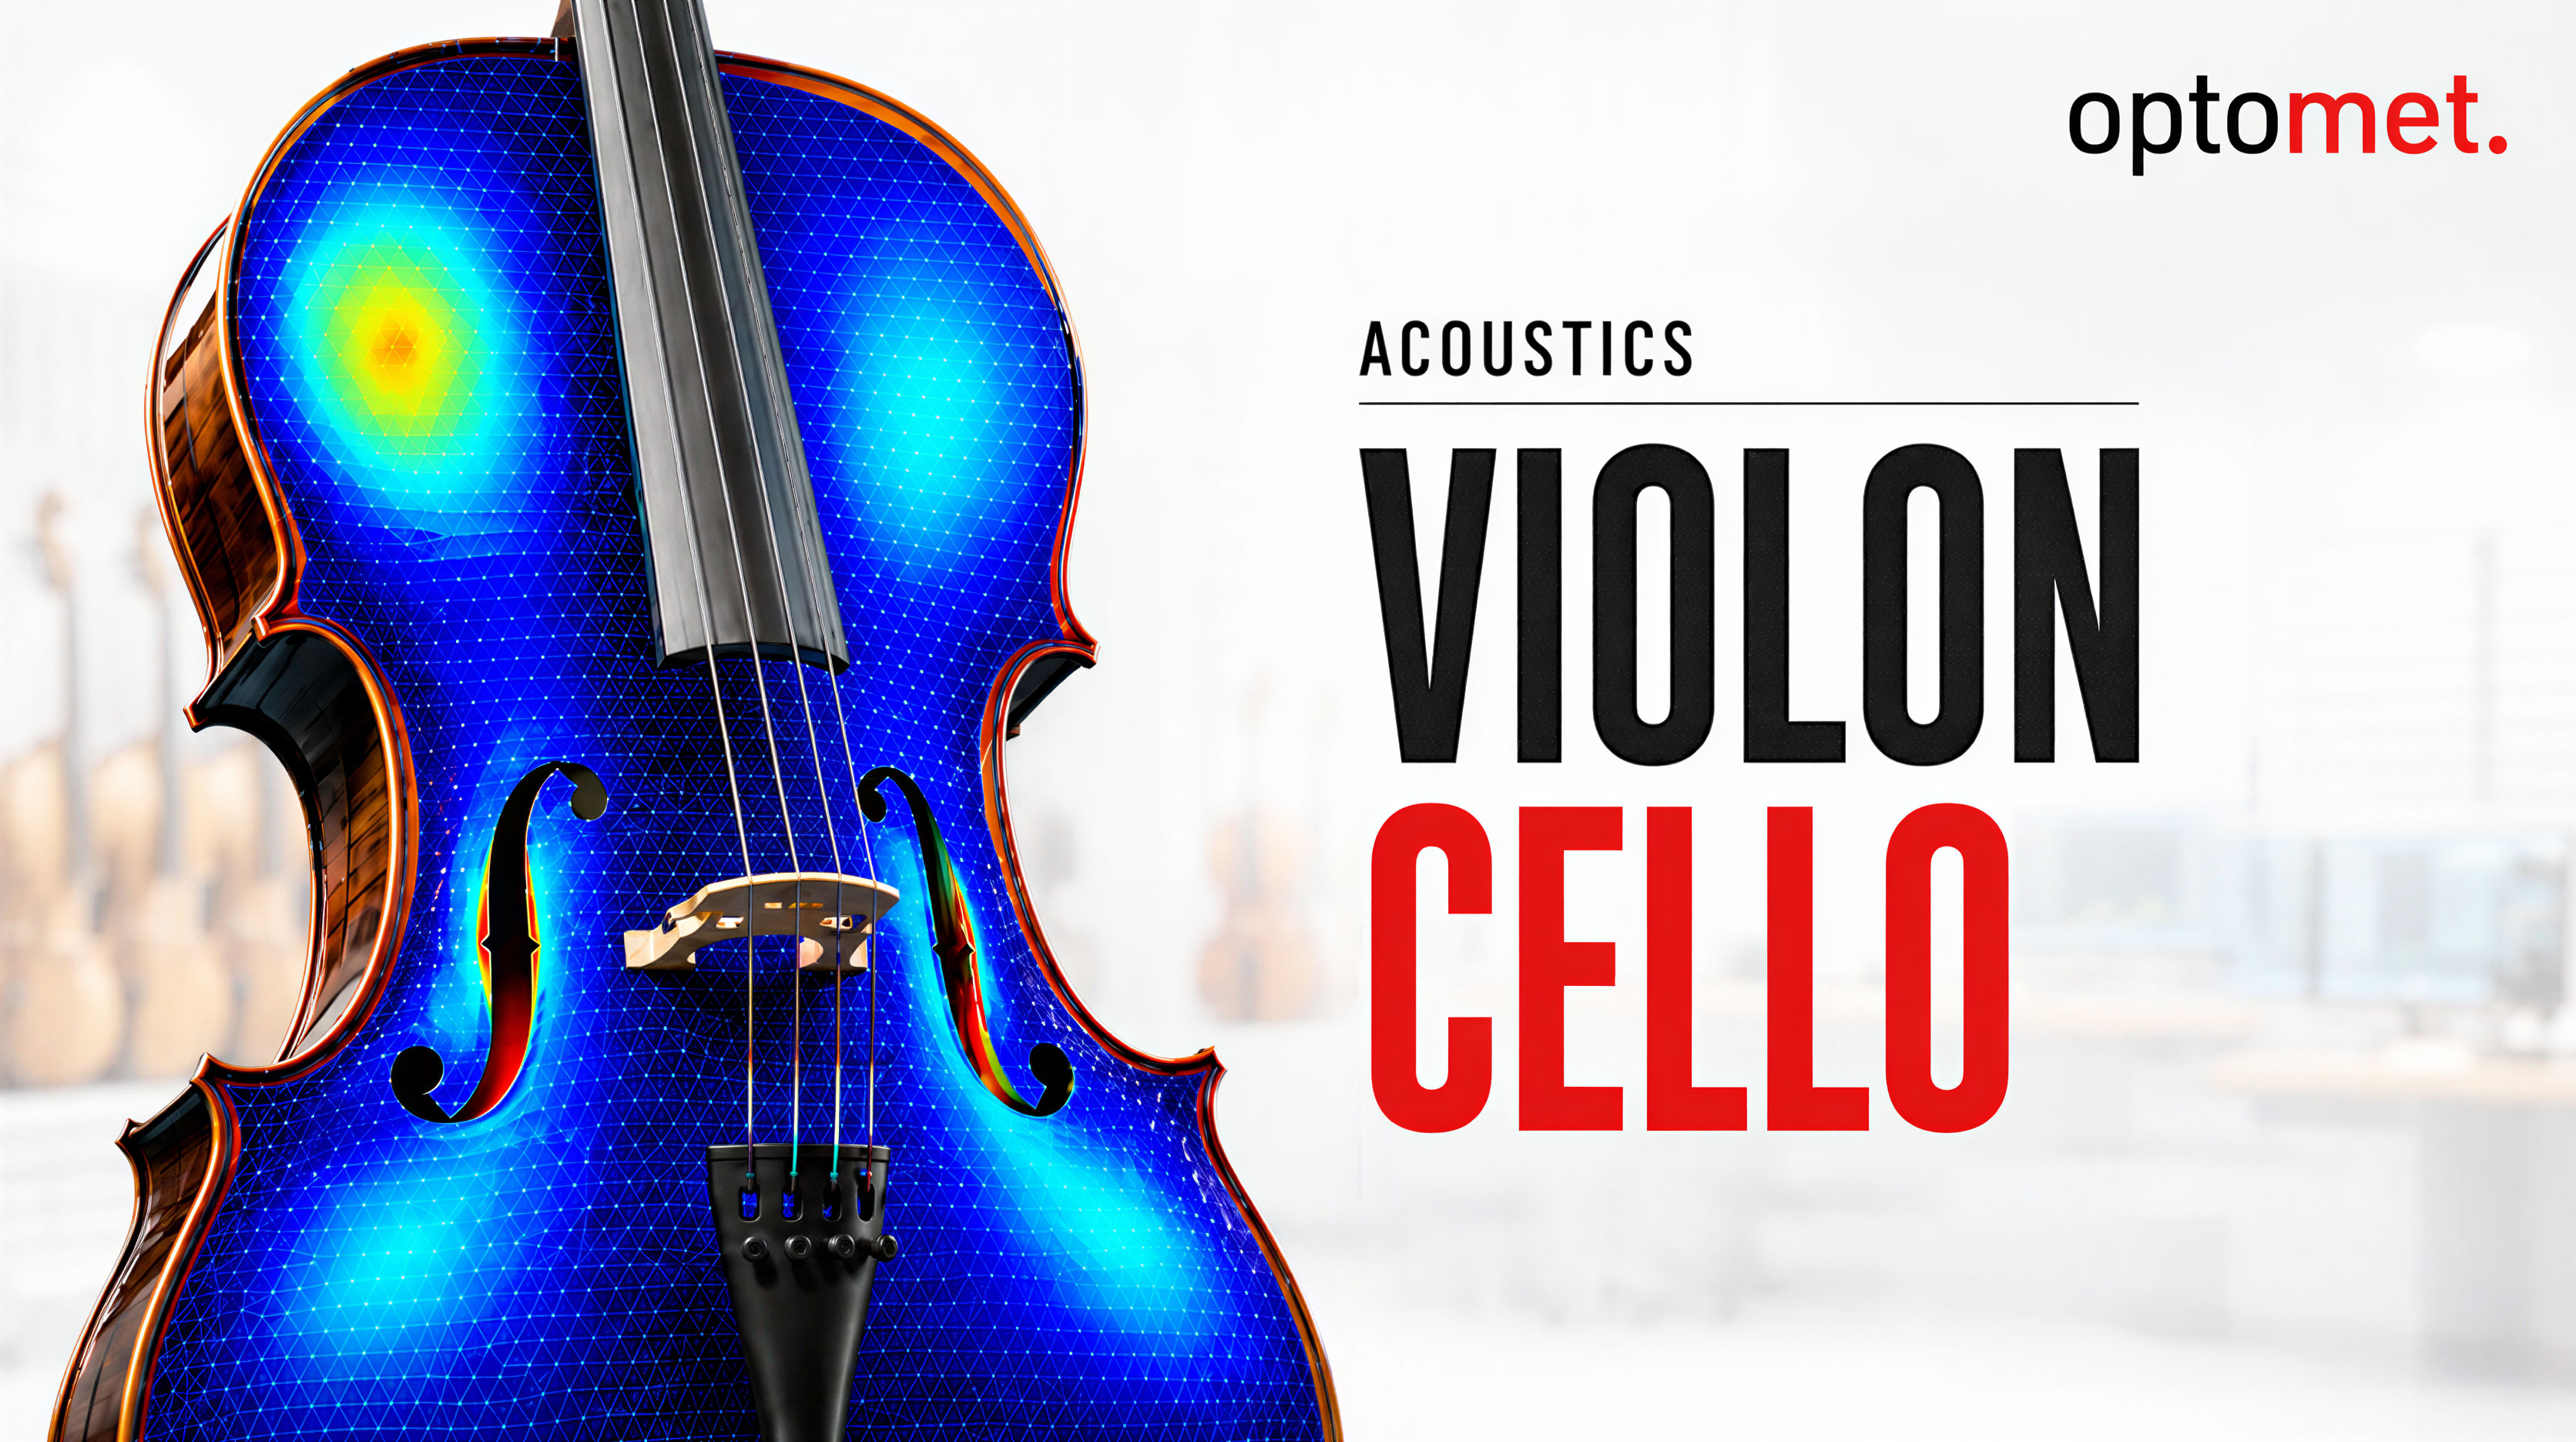
Vibration and Geometry of a Cello
Vibration and geometry of a cello captured in a single measurement: The SWIR scanning vibrometer uses an infrared laser to acquire vibration and distance data, creating a 3D model with the mode shapes visualized directly on its surface. [2020 | 1:12 min]
Open video page →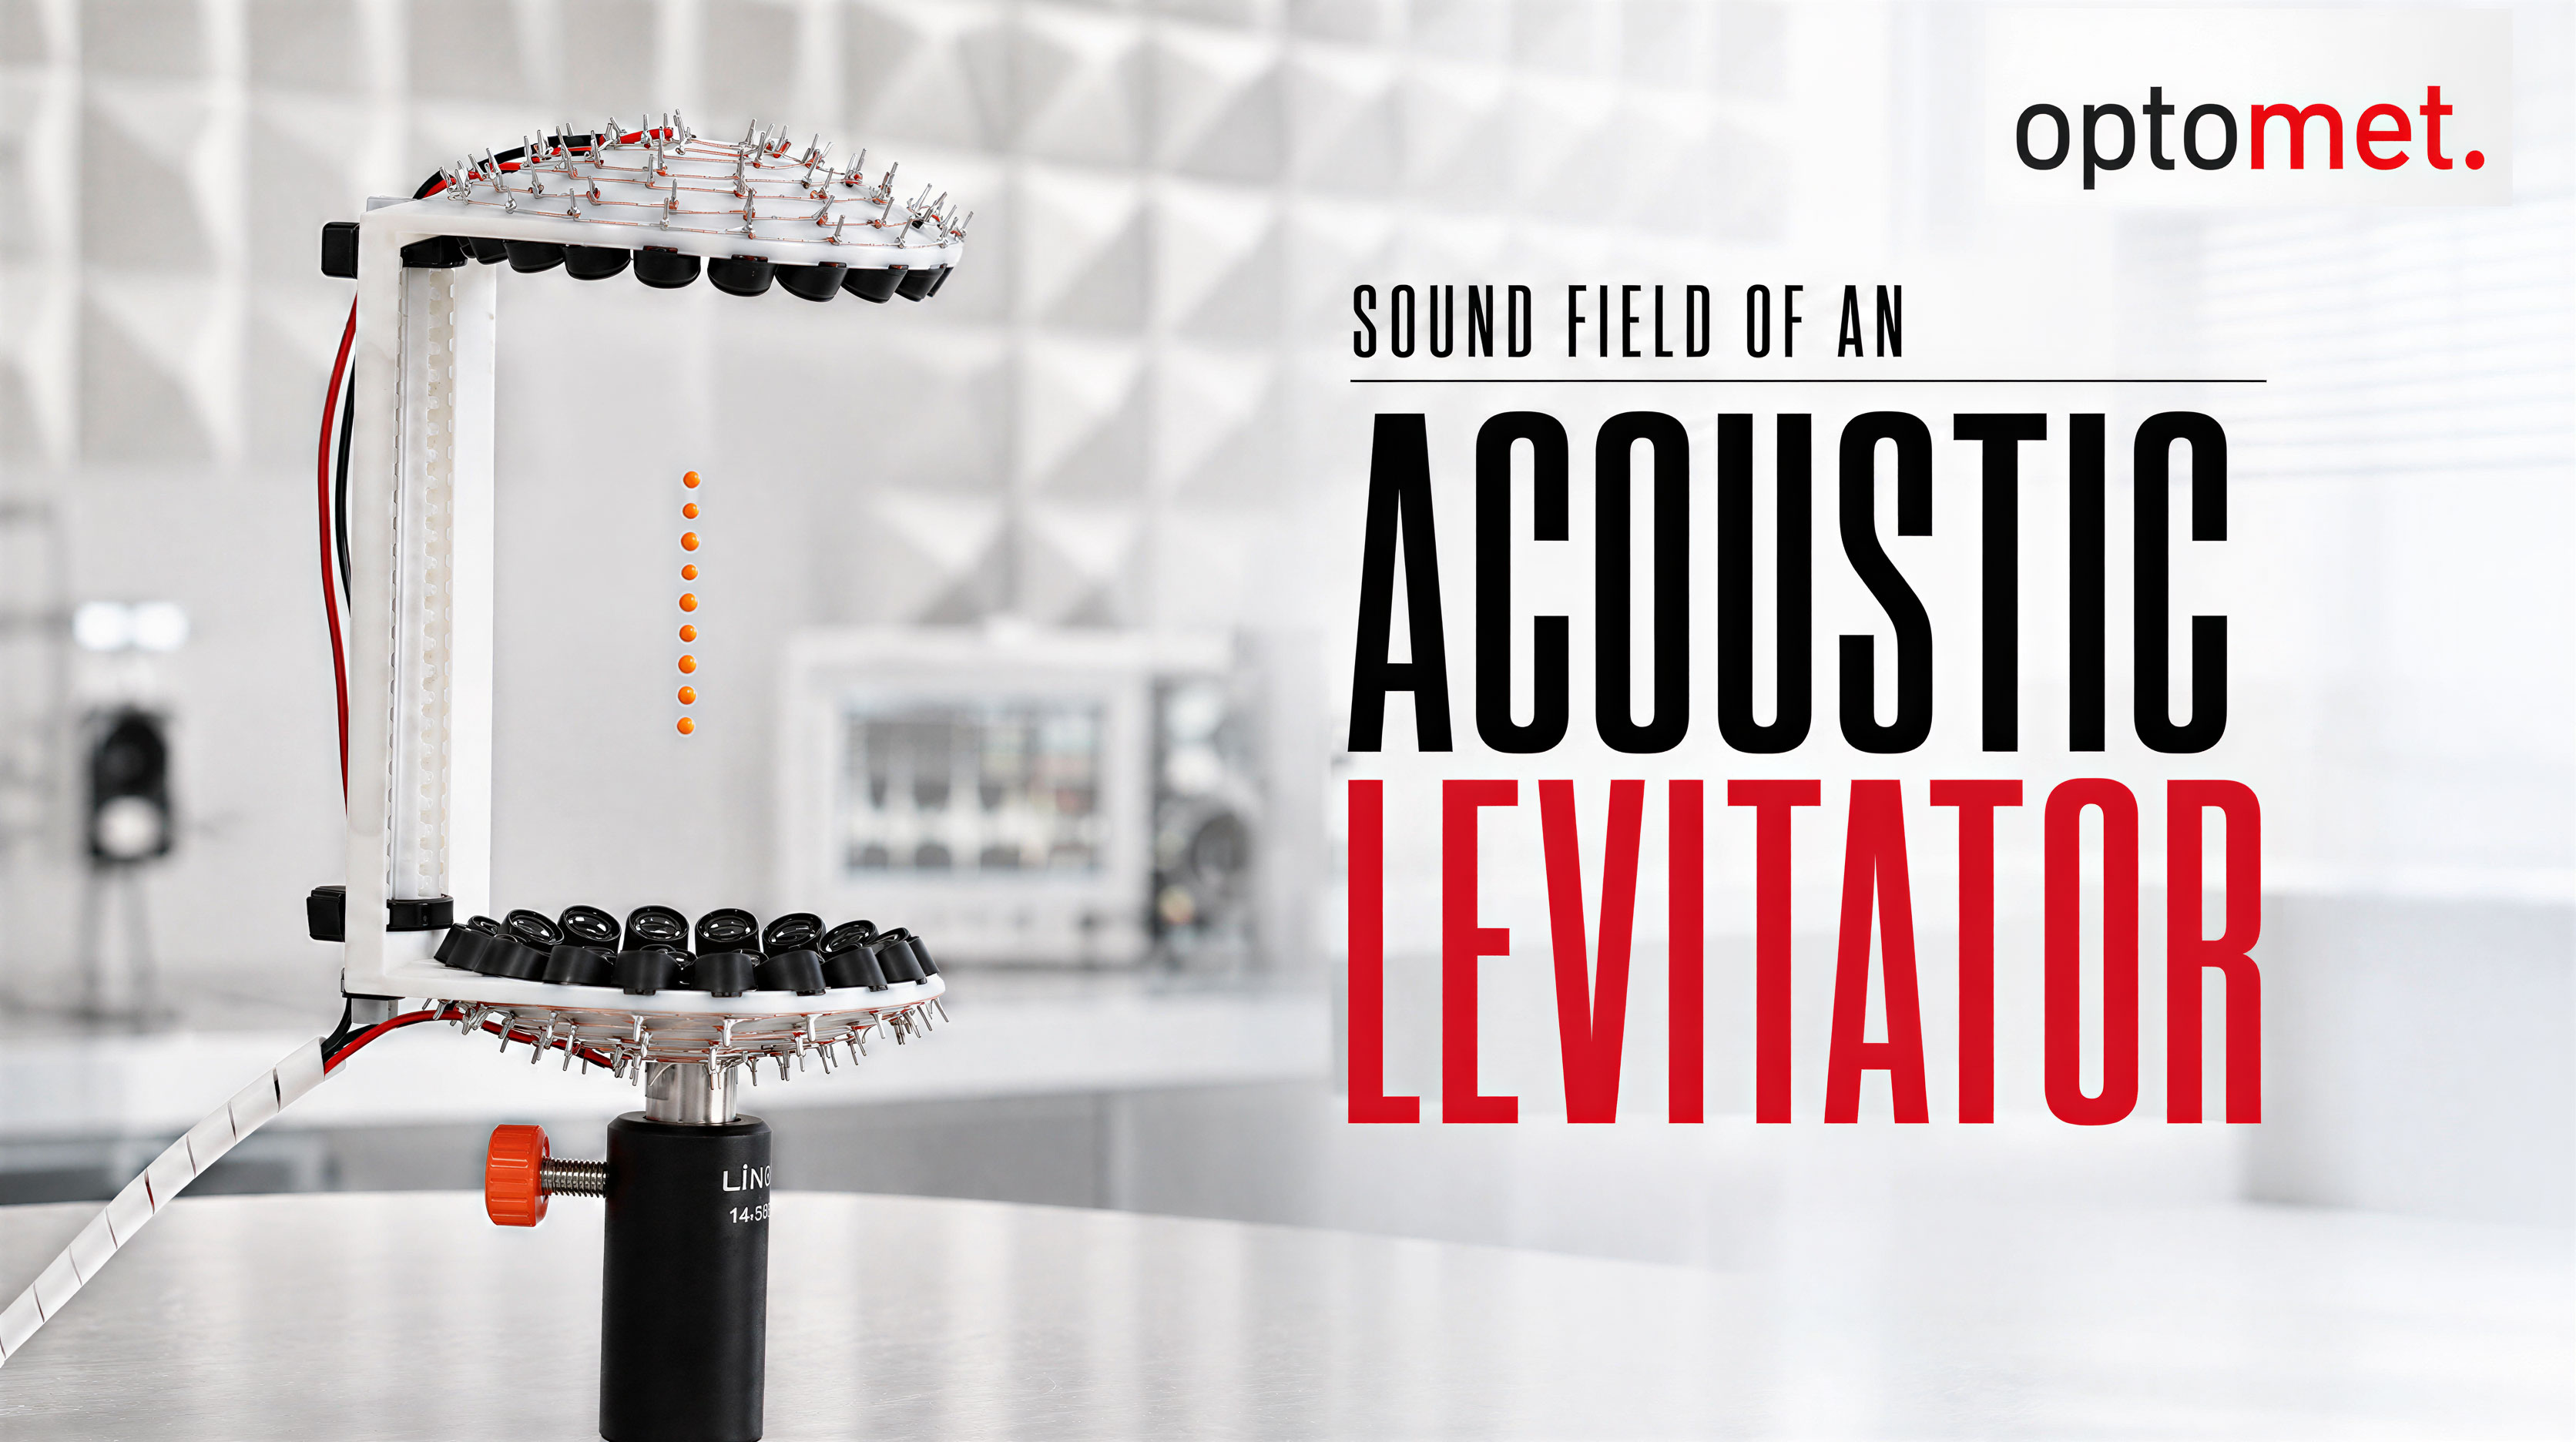
Sound field of an acoustic levitator
Ultrasound made visible: An acoustic levitator holds particles at the pressure nodes of a standing wave. The vibrometer maps the sound field by detecting changes in the refractive index of the air, producing amplitude and phase images. [2020 | 1:12 min]
Open video page →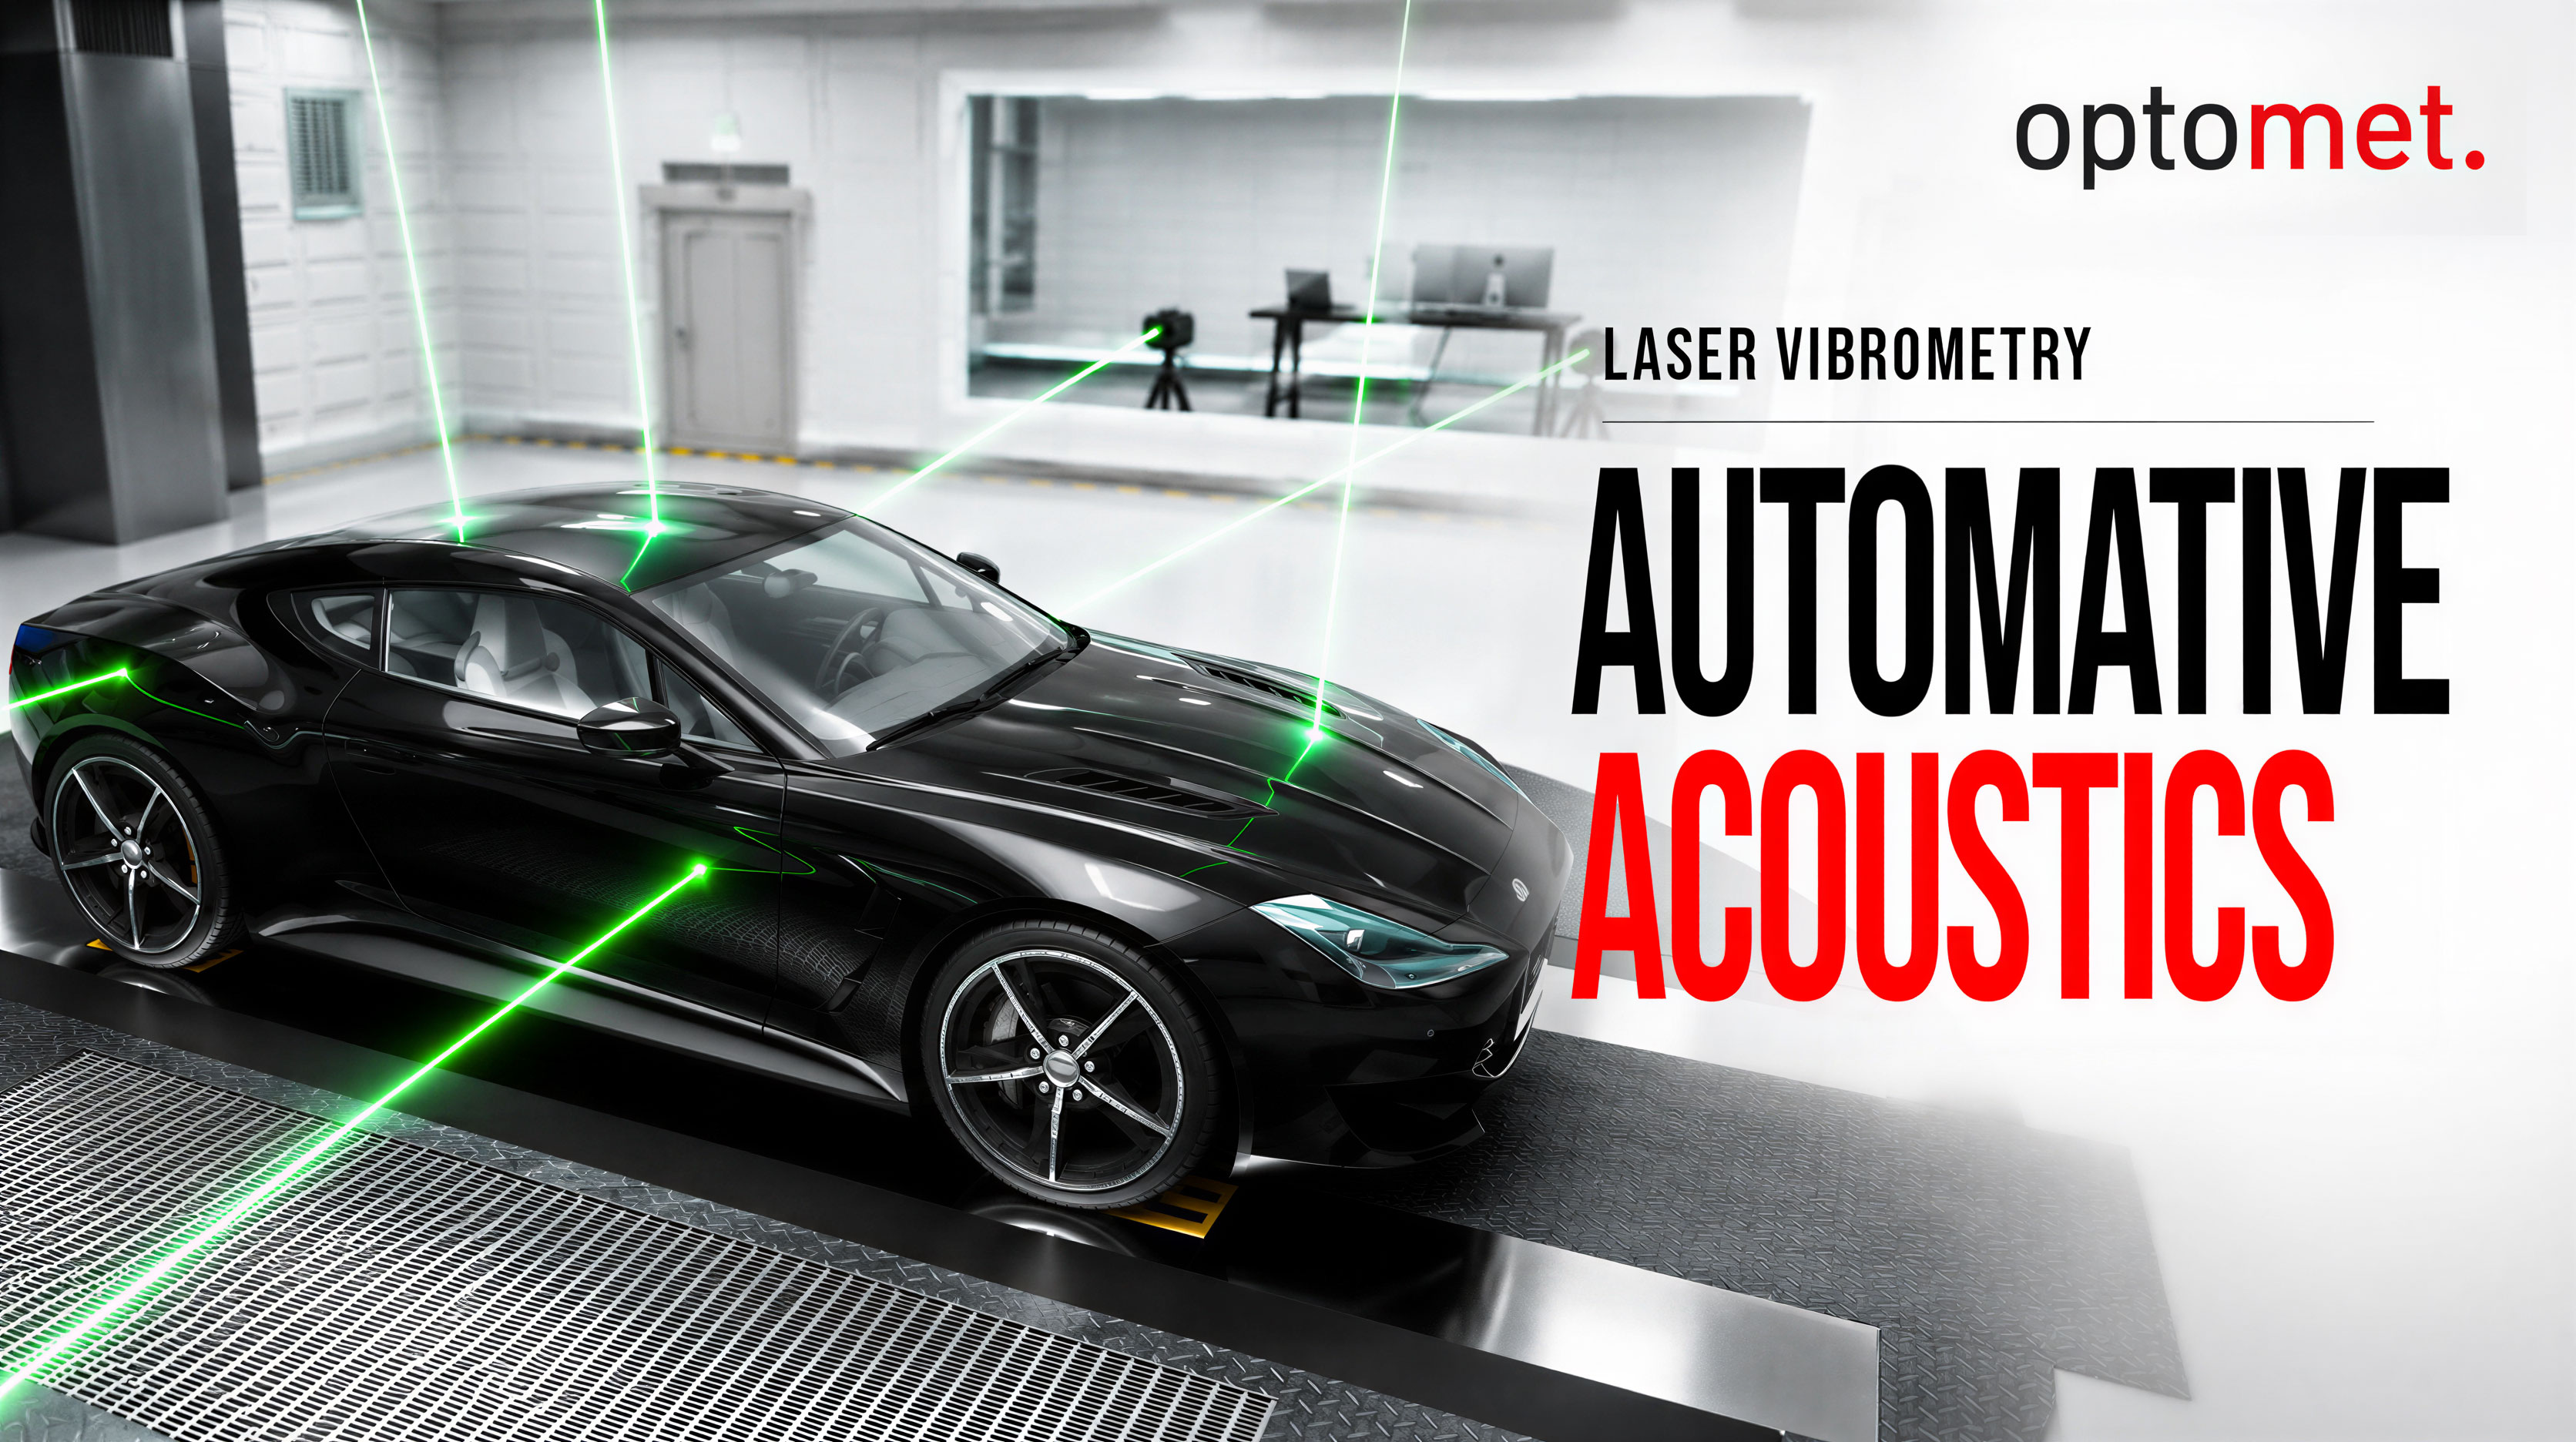
Automotive acoustic engineering with laser vibrometry
Automotive acoustic engineering: Laser vibrometers capture the entire surface of the vehicle body on the test bench in real time. SmartLab imports 3D models (NASTRAN, STL), while the data acquisition system directly integrates conventional NVH sensors. [2024 | 0:45 min]
Open video page →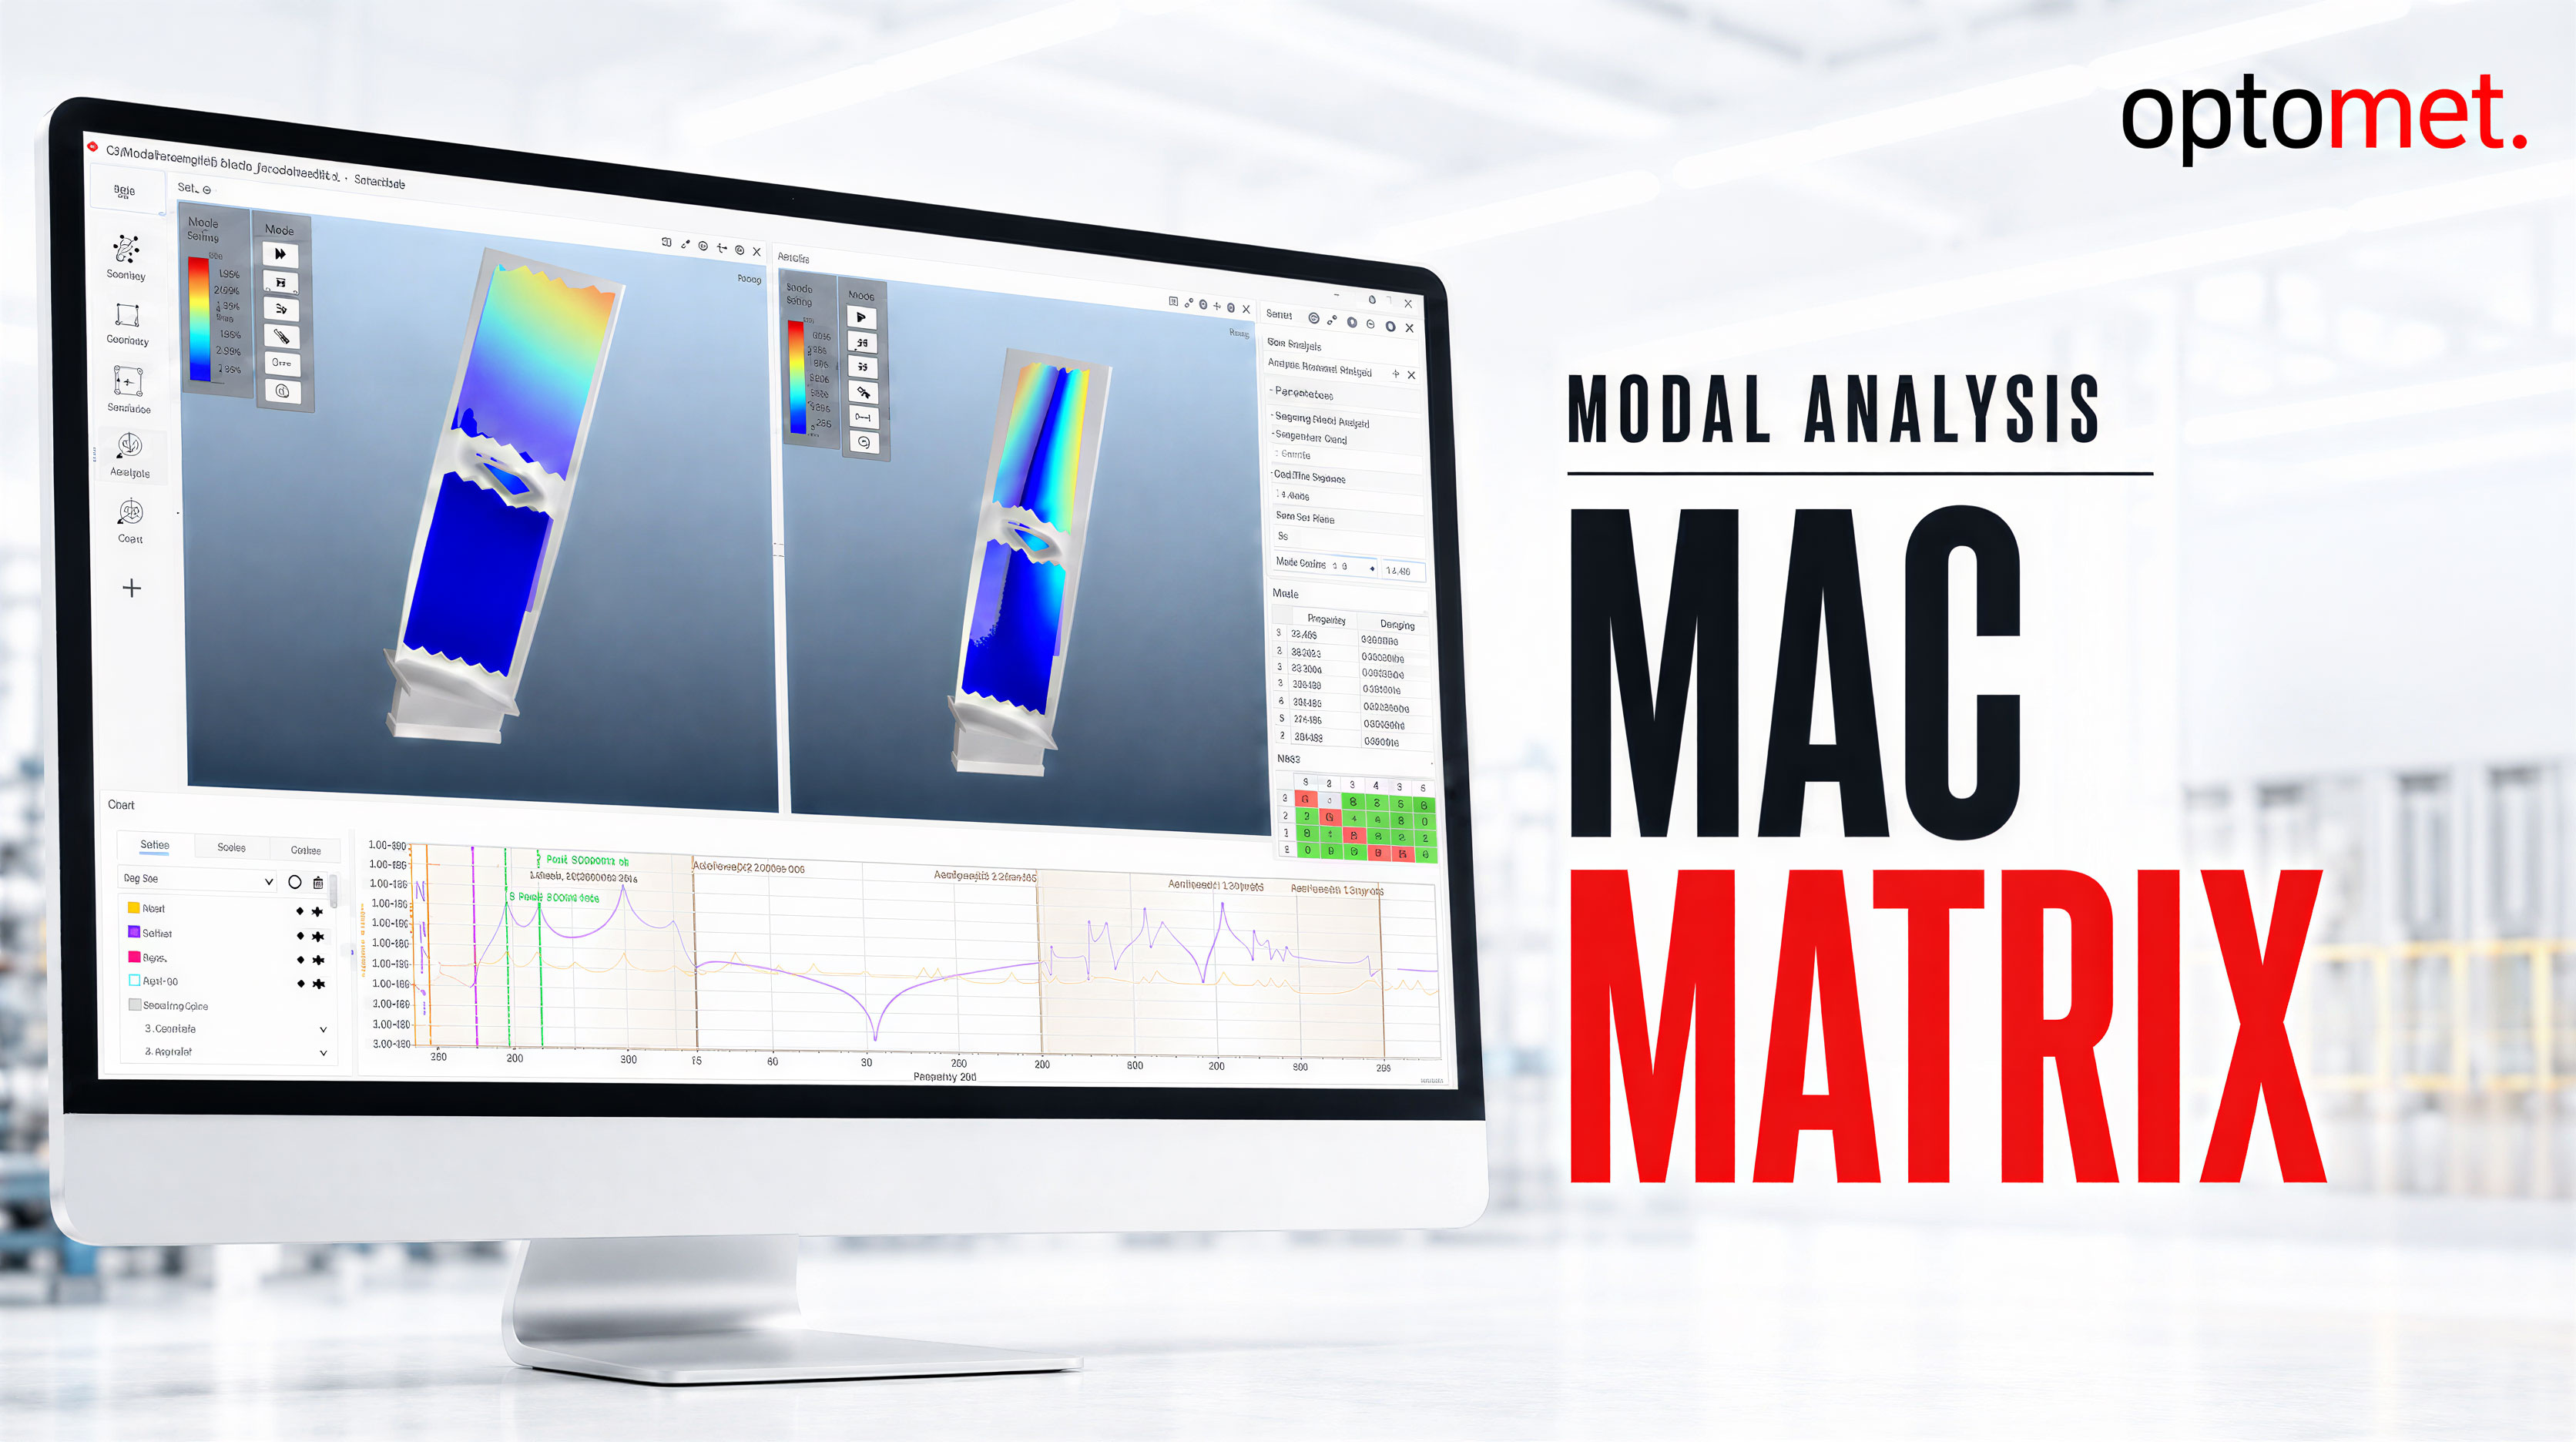
Modal analysis of a turbine blade with SMART Lab
Quick software insight: Modal analysis of a turbine blade in SMART Lab. Shown are natural frequencies with damping values, the MAC matrix for mode comparison, and fitted frequency response functions with automatic peak detection. [2025 | 0:22 min]
Open video page →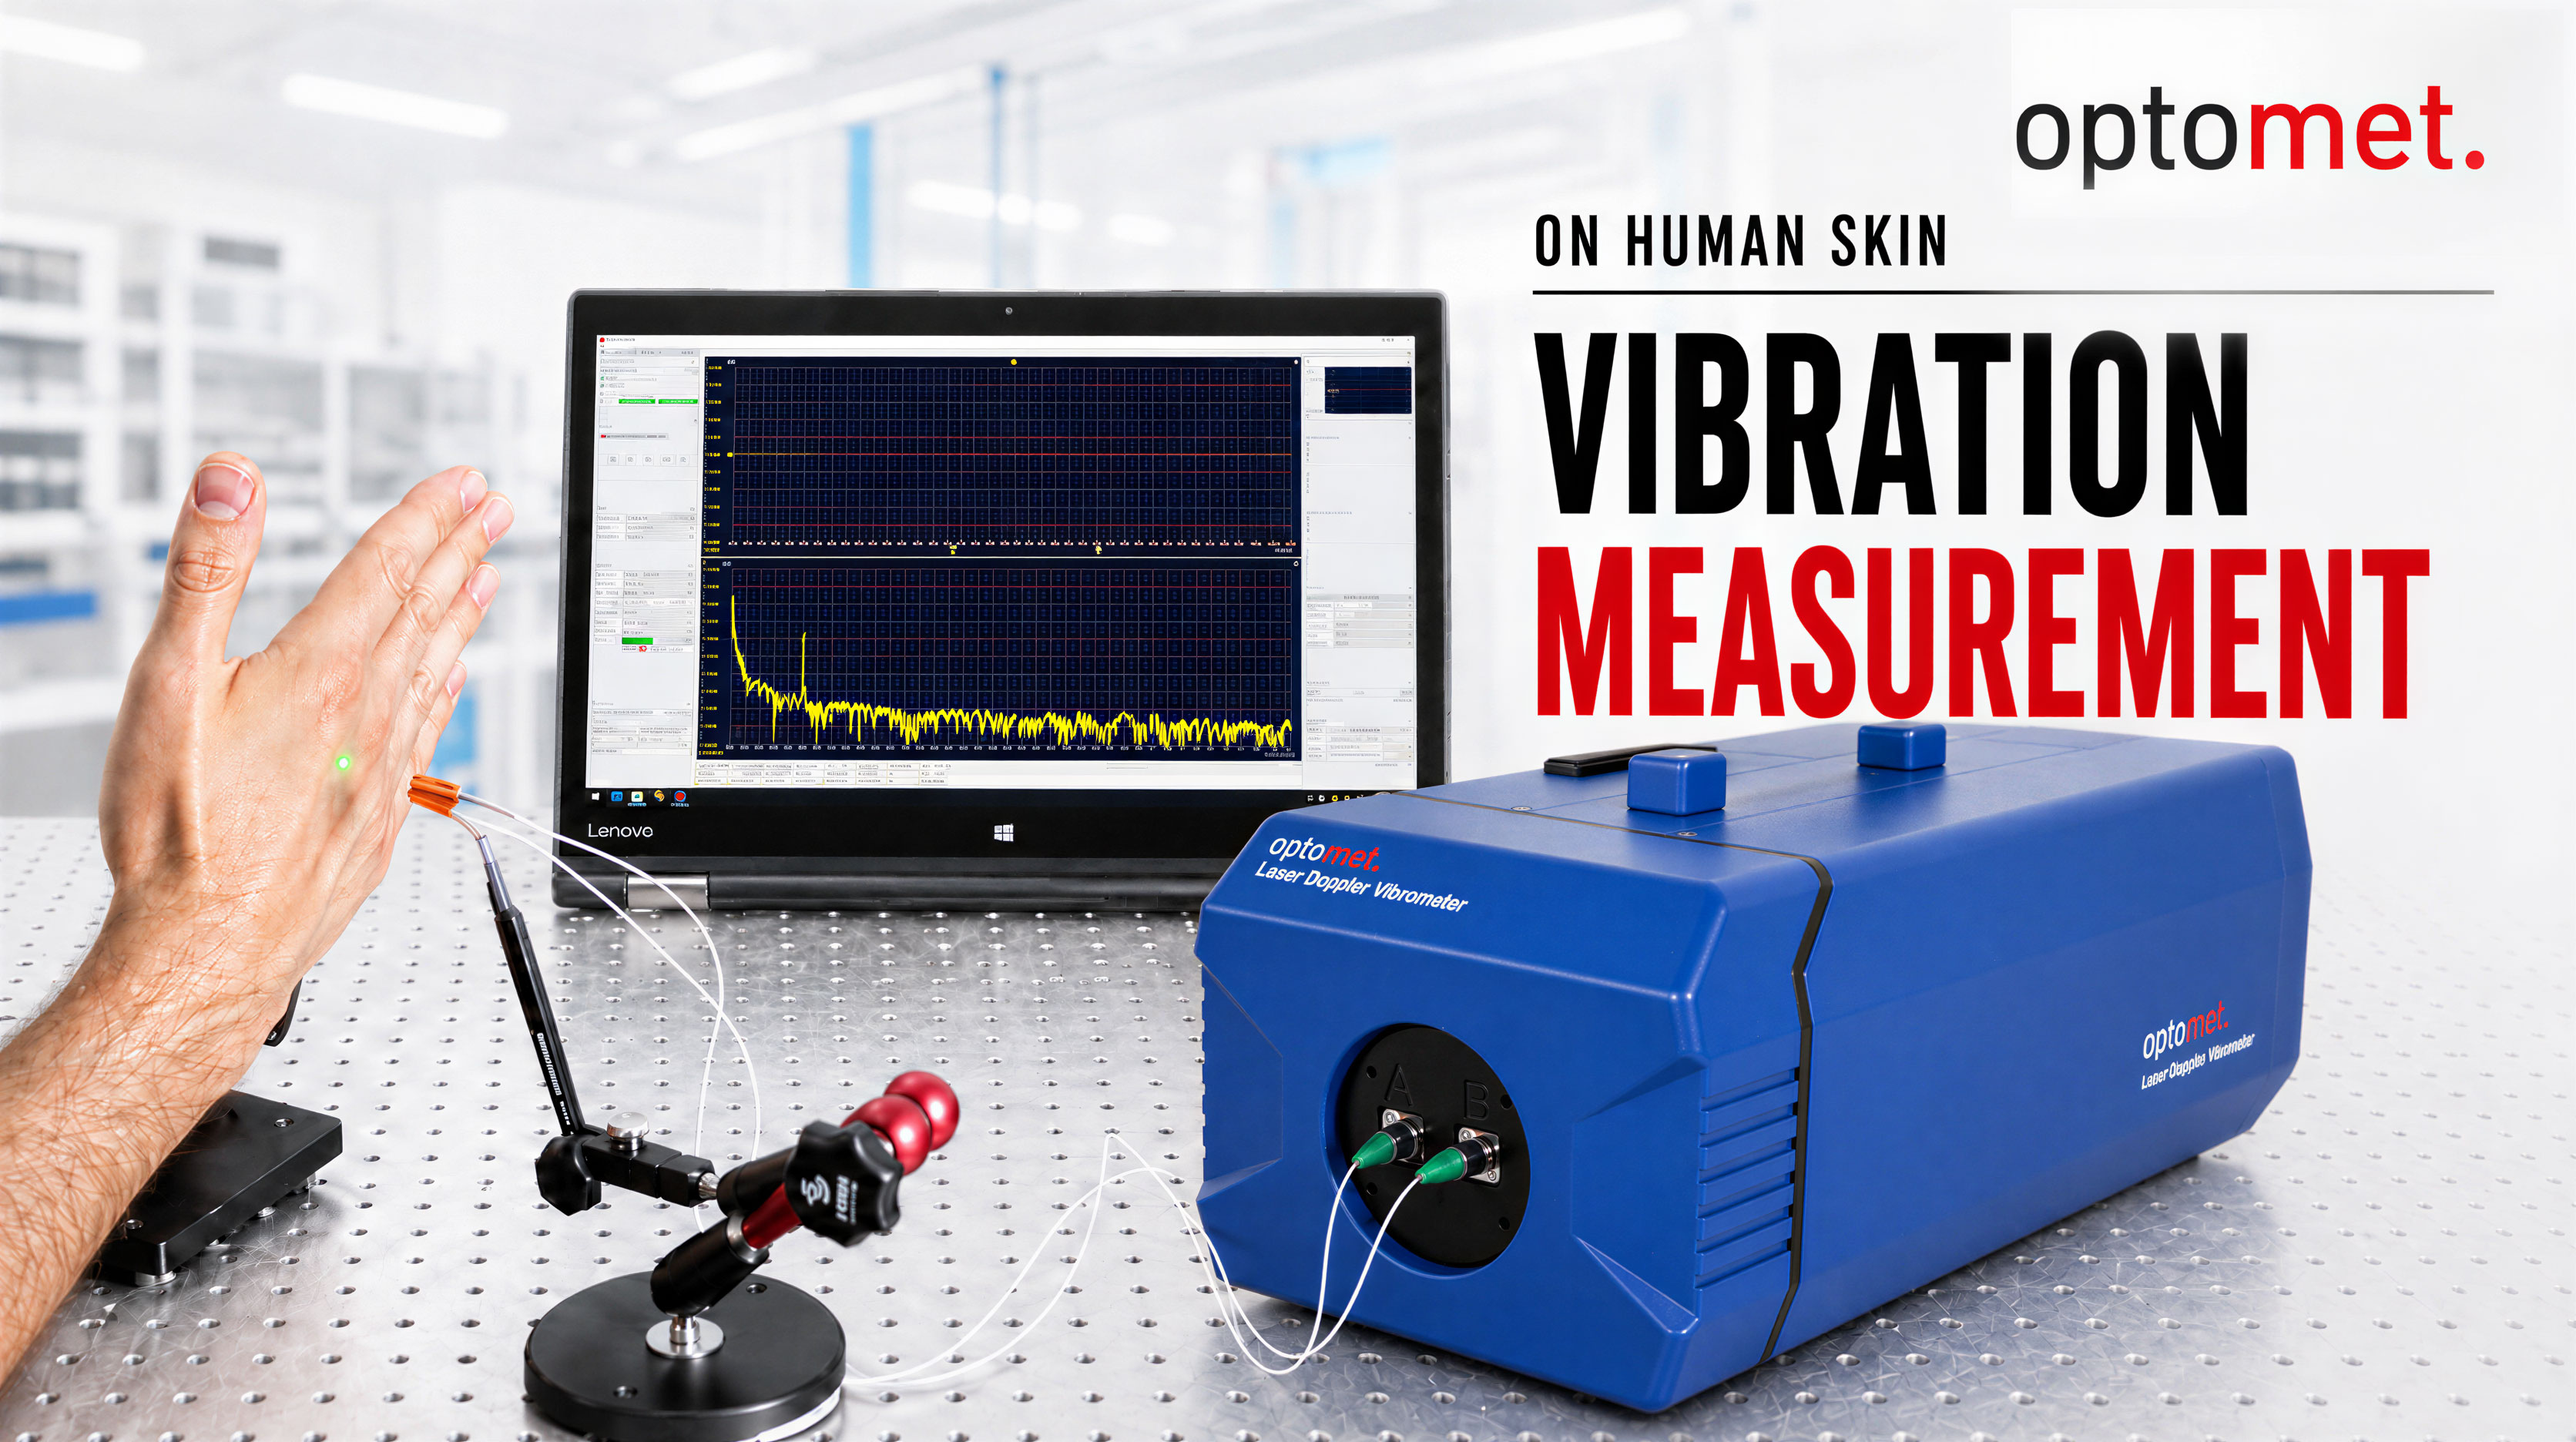
Vibration measurement on human skin
Vibration measurement directly on human skin: The compact fiber-optic sensor head captures the movement of the palm without contact, while the spectrum is displayed live in the software. Ideal for medical technology and biomechanics. [2019 | 0:16 min]
Open video page →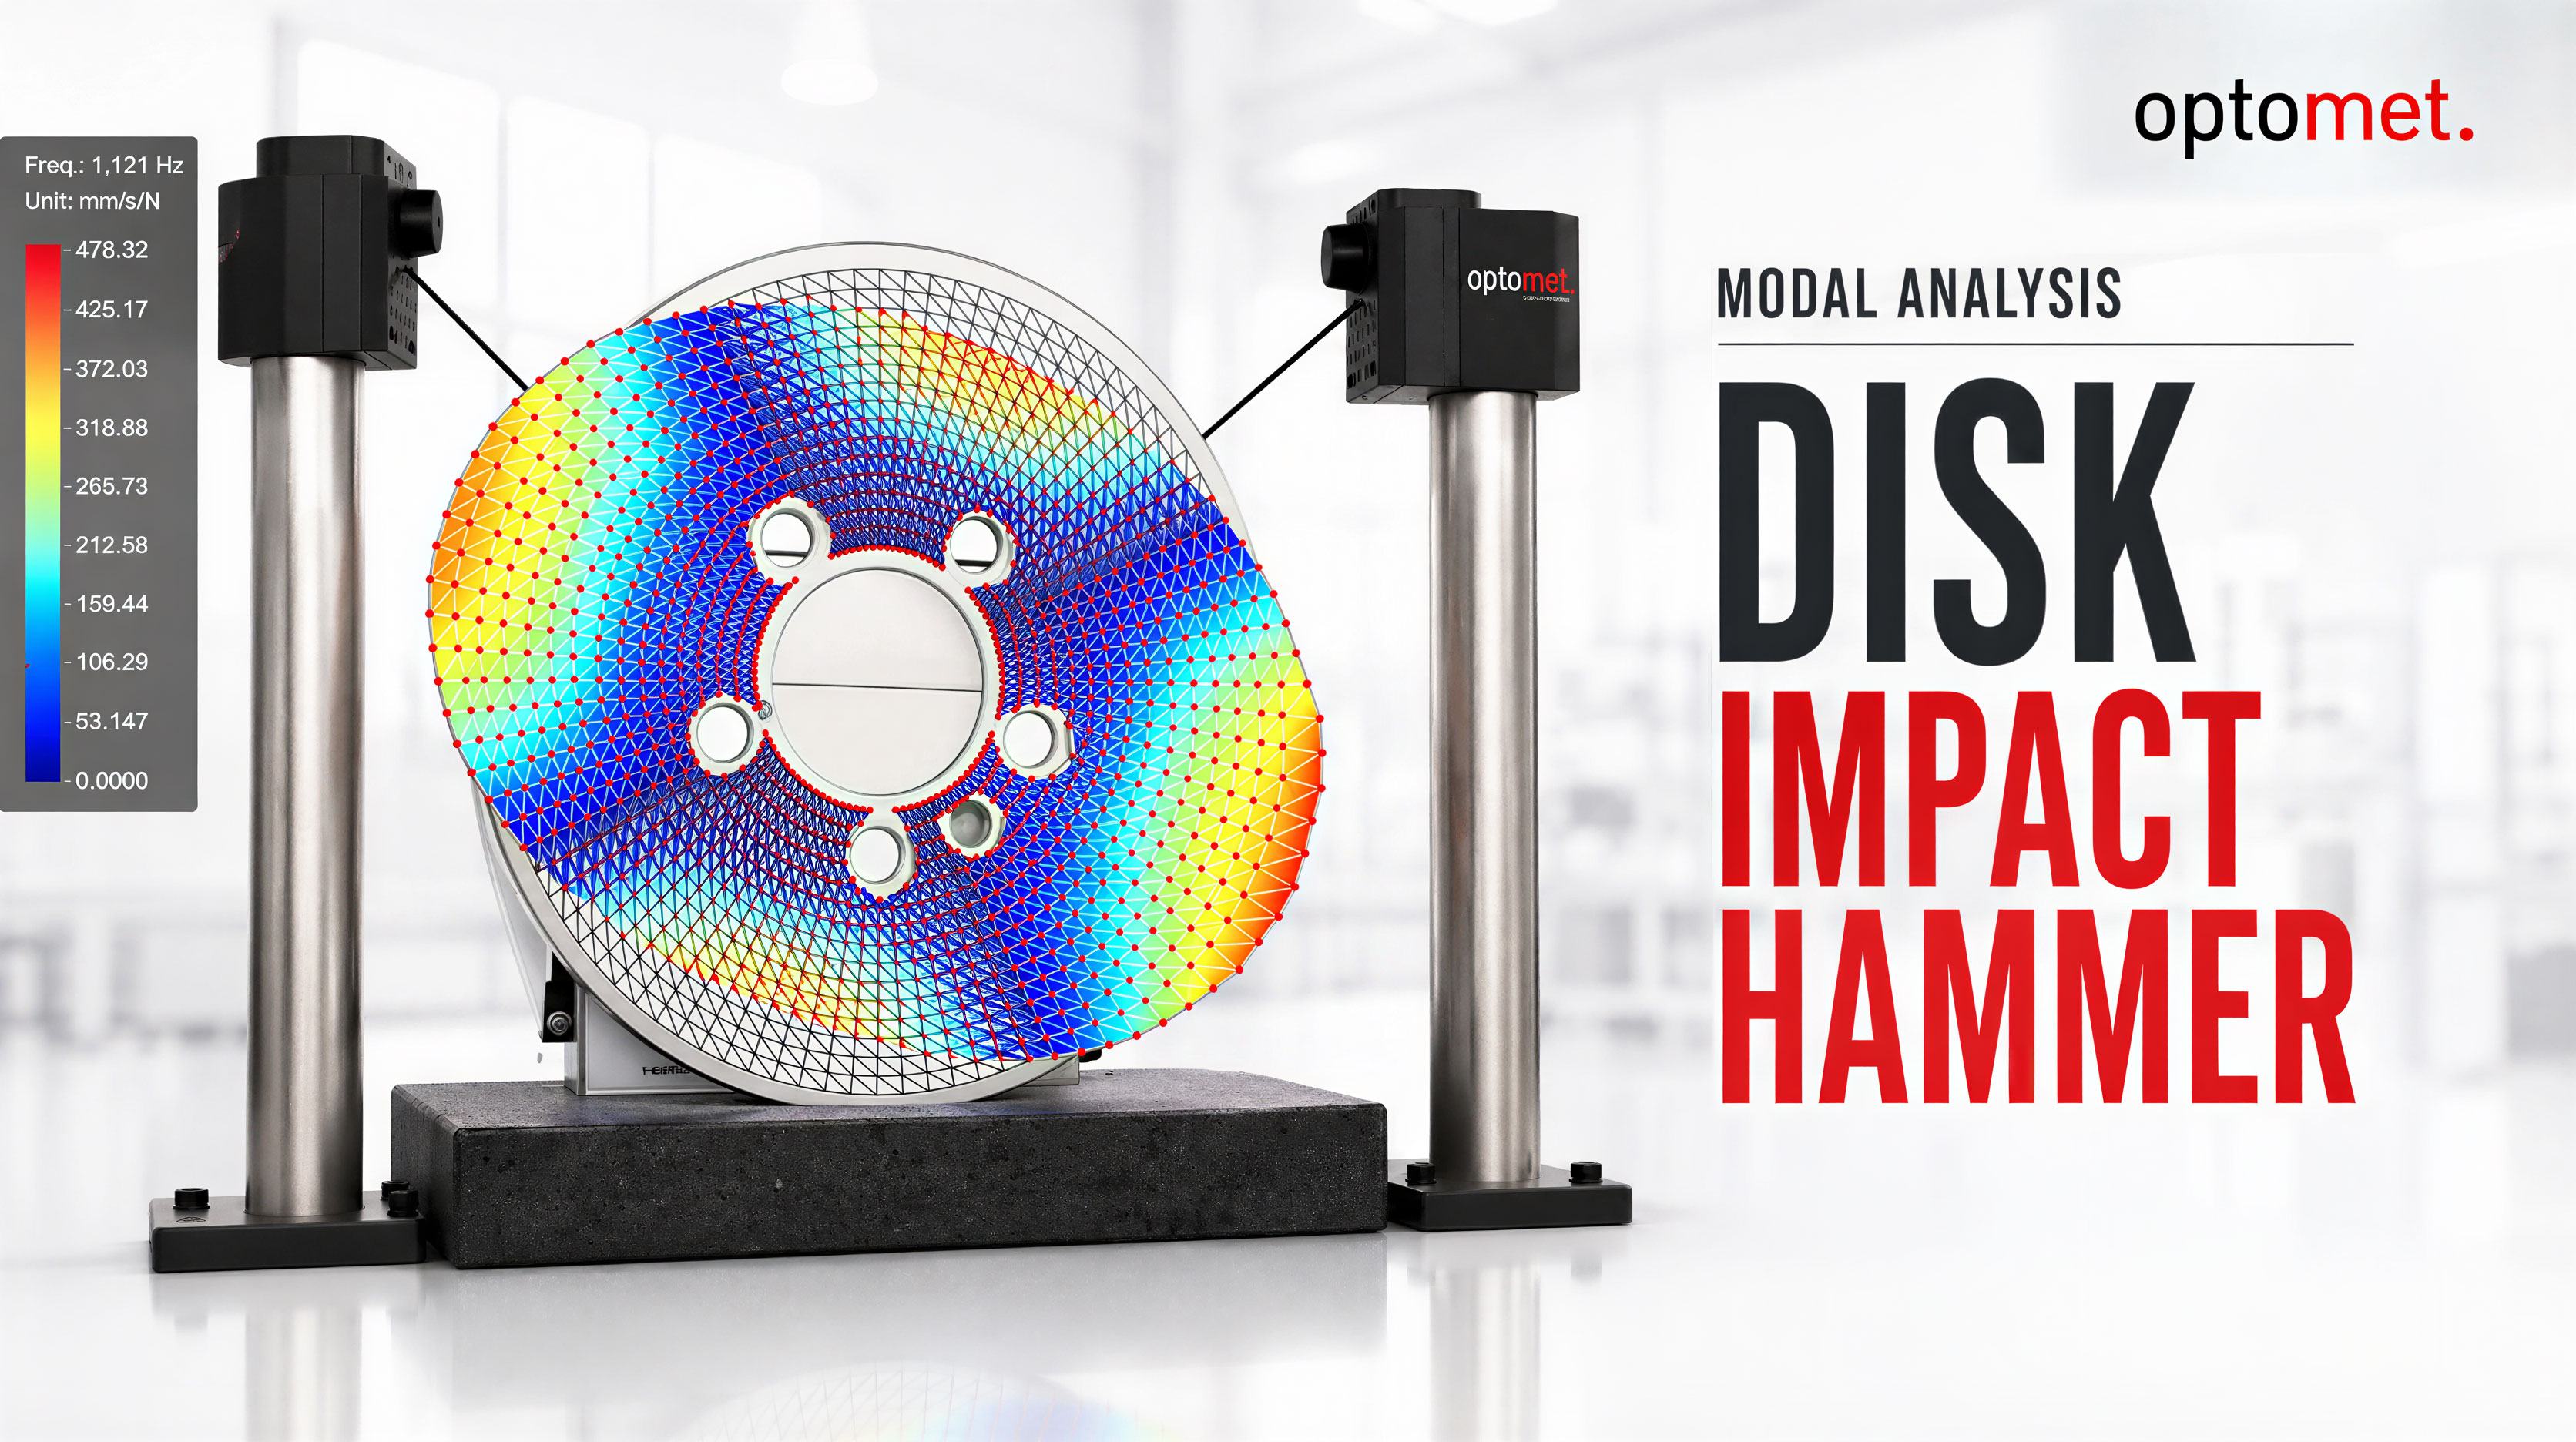
Modal analysis – disk and impact hammer
Screencast of a modal analysis: A disc is excited using an impact hammer, while the software displays time signals, frequency response functions, and identified modes with their respective frequencies and damping. The mode shapes are animated on the mesh. [2021 | 1:49 min]
Open video page →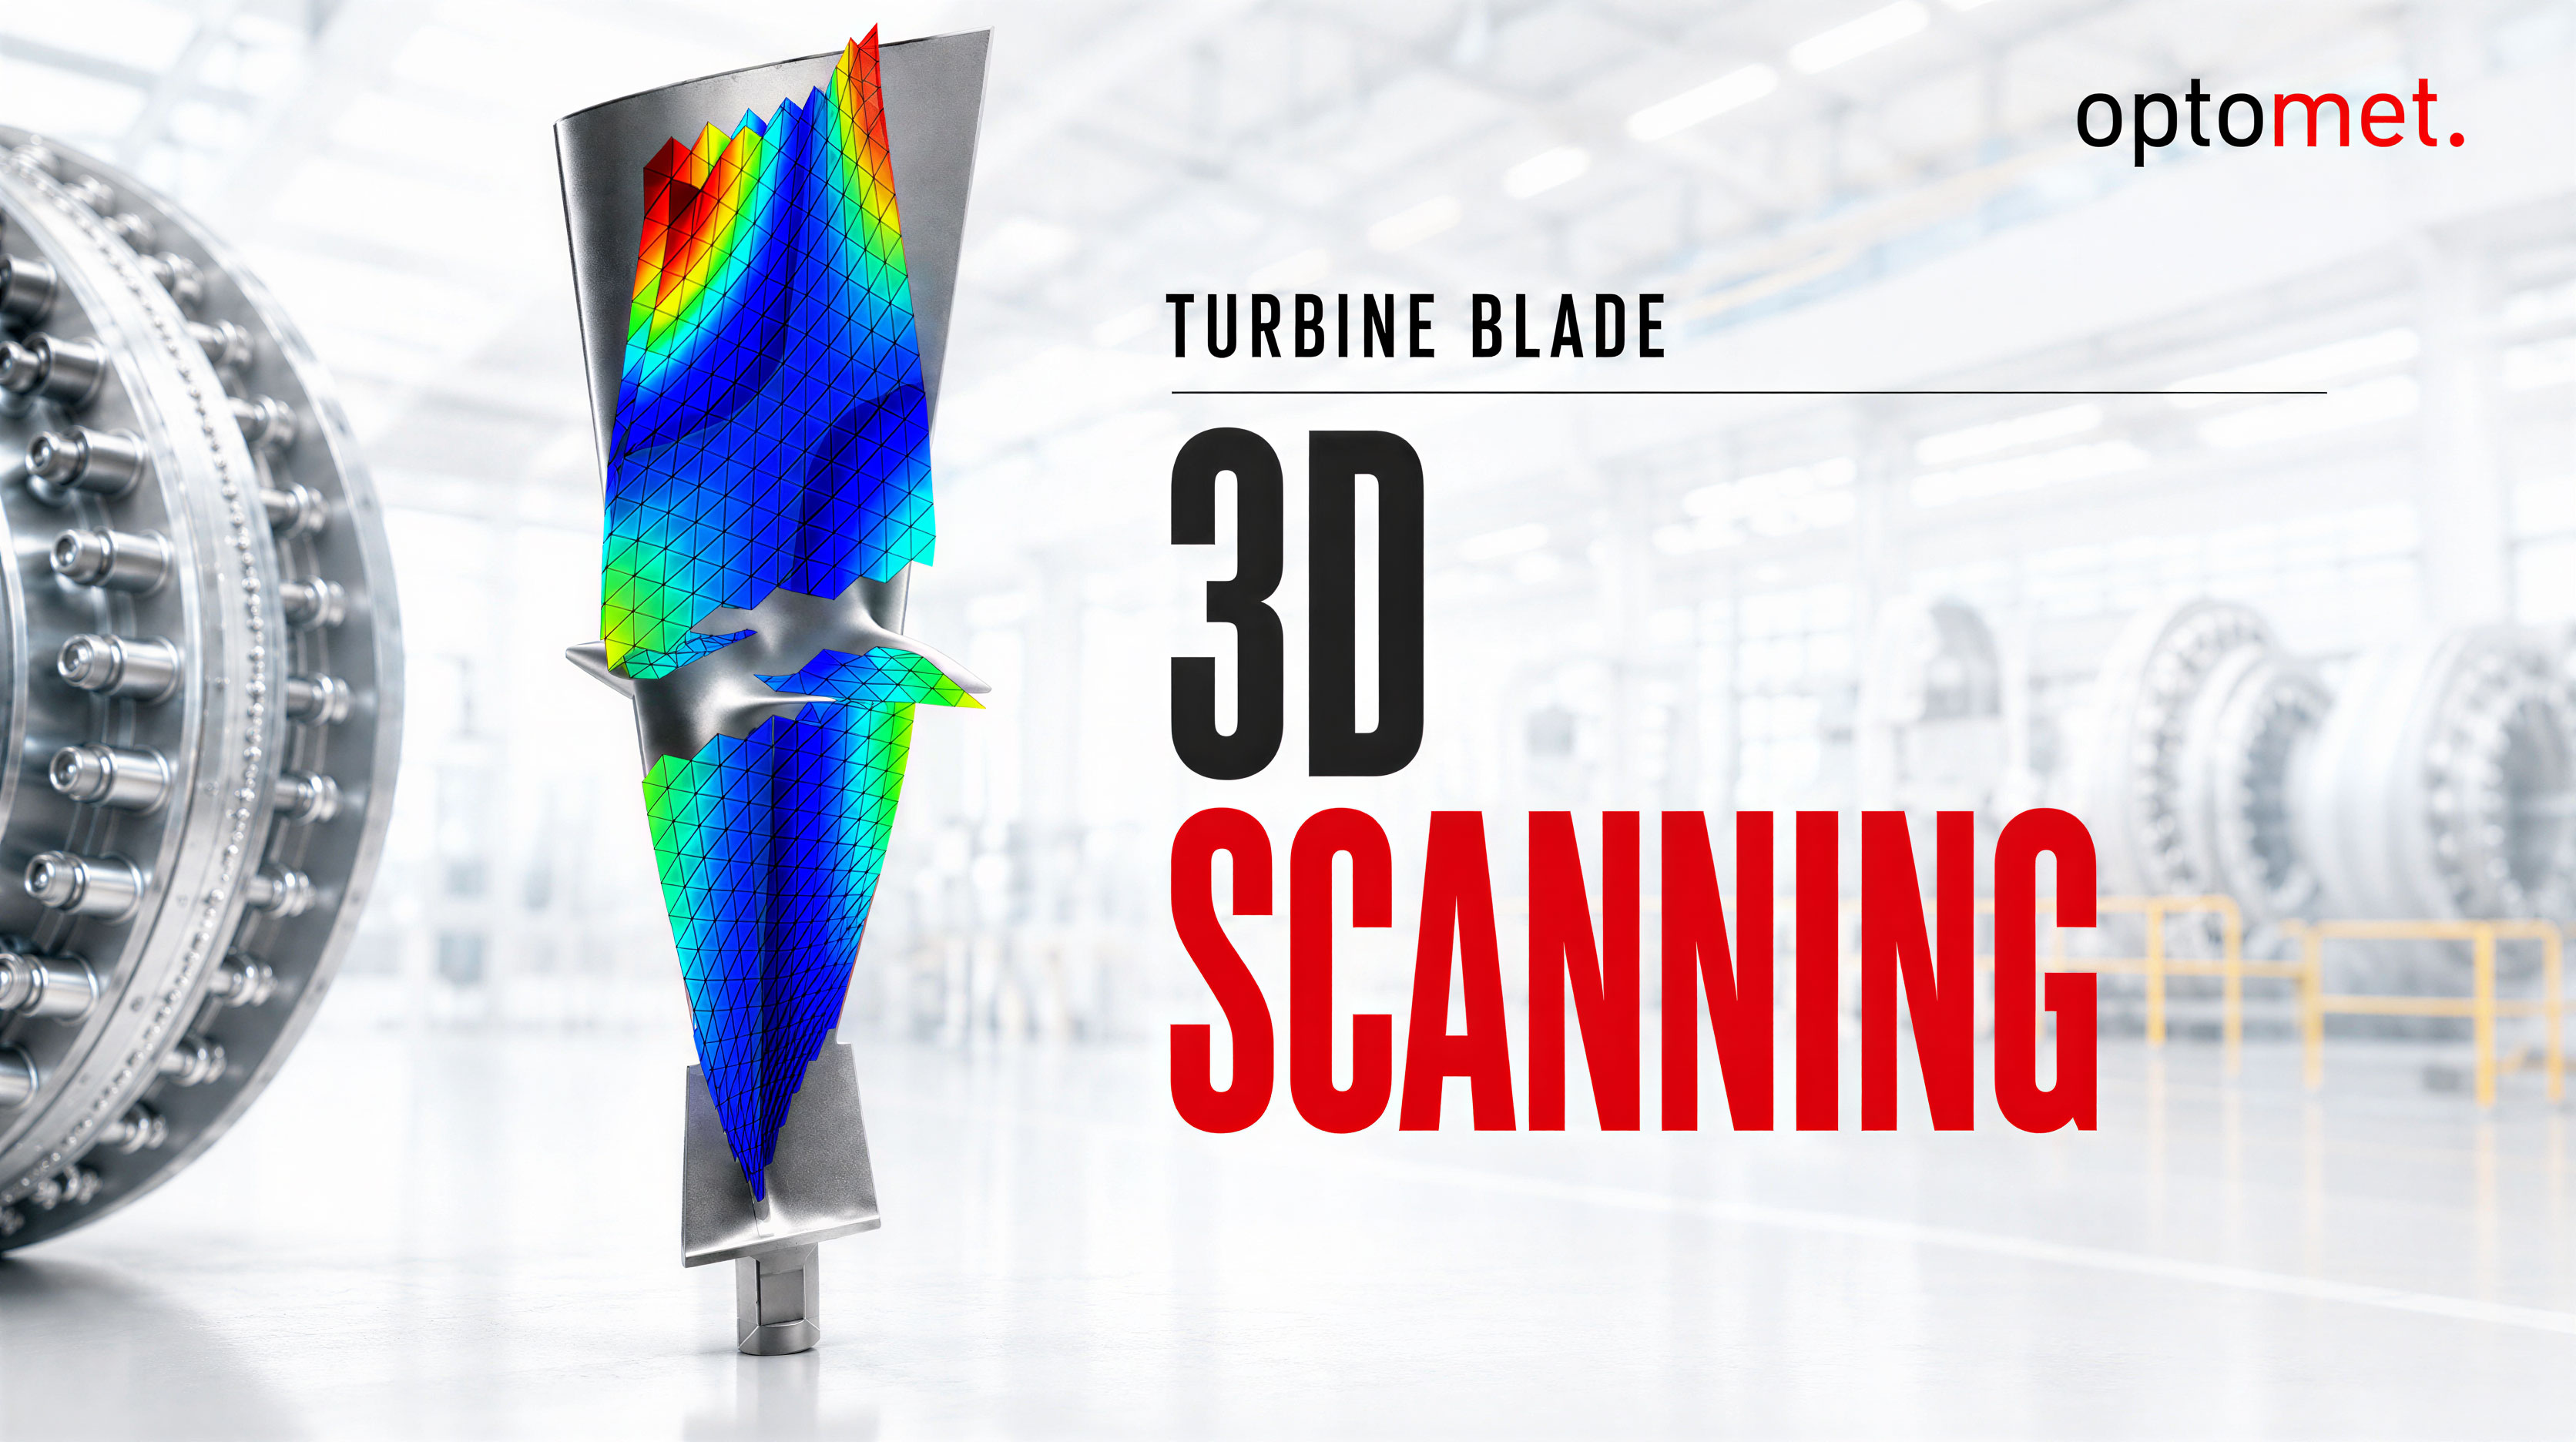
Turbine blade – mode shape at 1883 Hz
Short animation loop: the mode shape of a turbine blade at 1.883 Hz, measured using scanning laser vibrometry. [2025 | 0:04 min]
Open video page →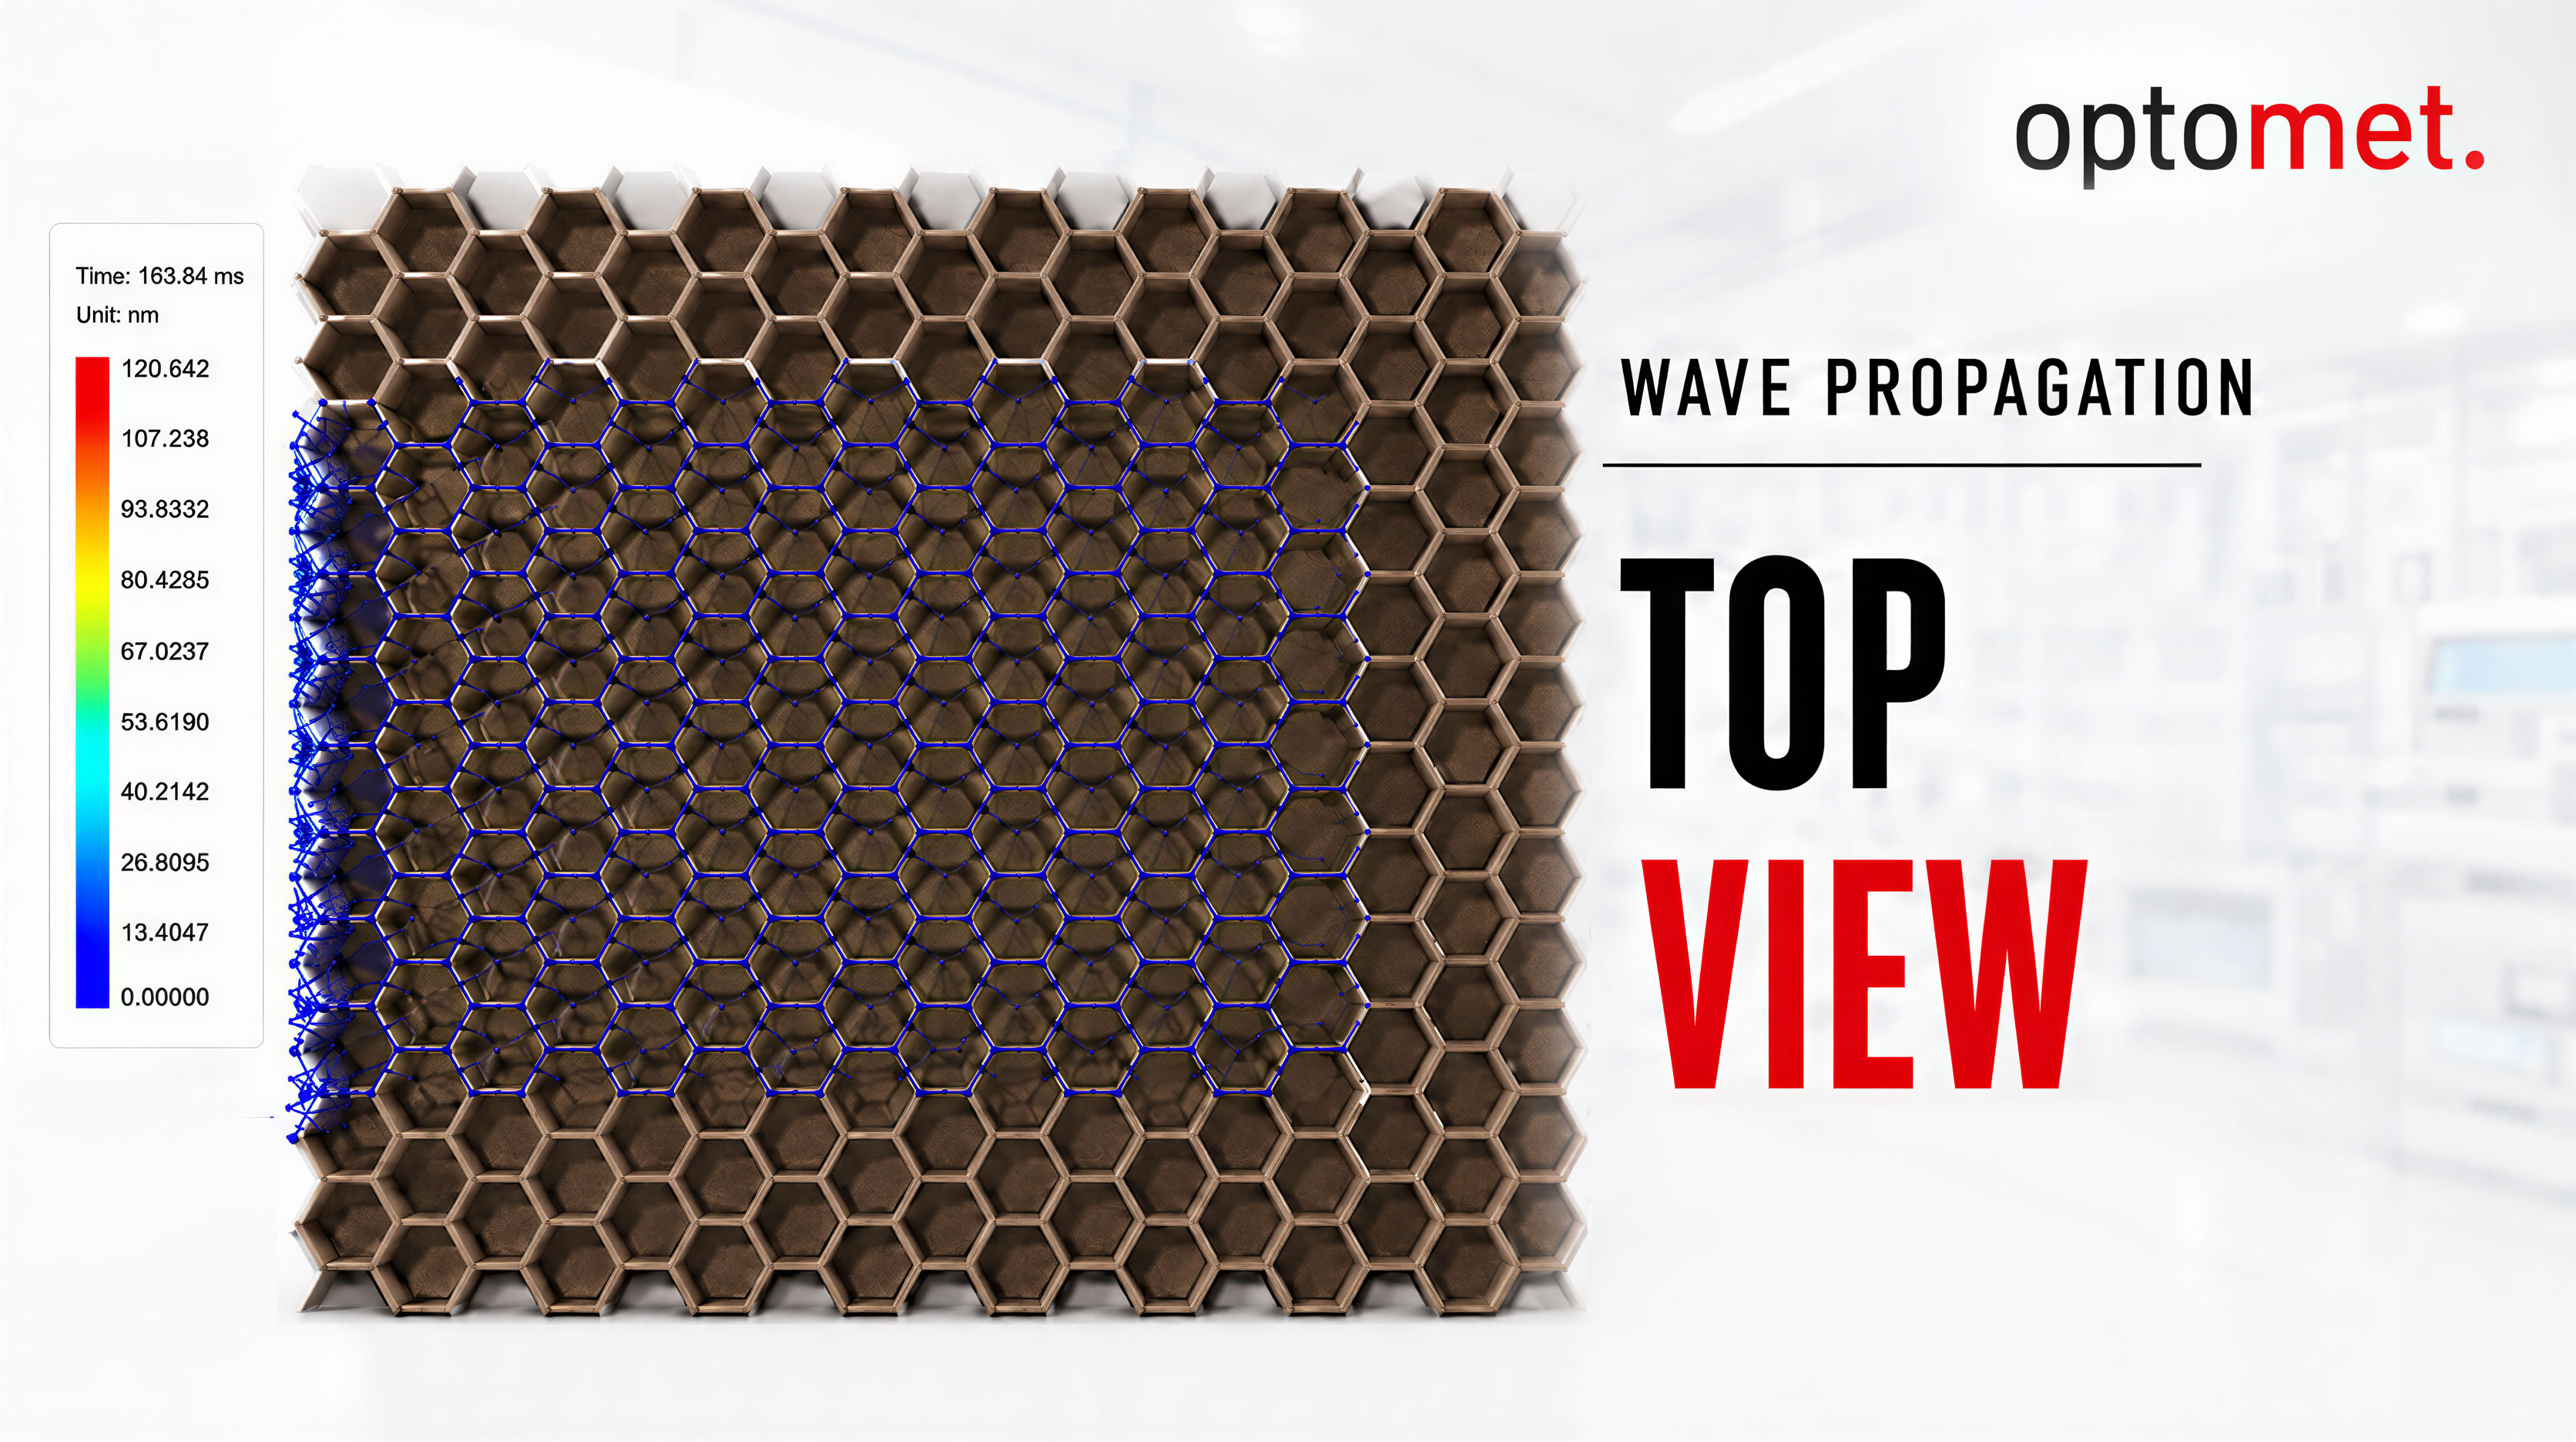
Time-domain view – top view
Time-domain visualization of vibration propagation in a honeycomb structure, viewed from above. The spatially resolved measurement shows the vibration field propagating across the structure, with displacement amplitudes in the nanometer range. [2020 | 0:13 min]
Open video page →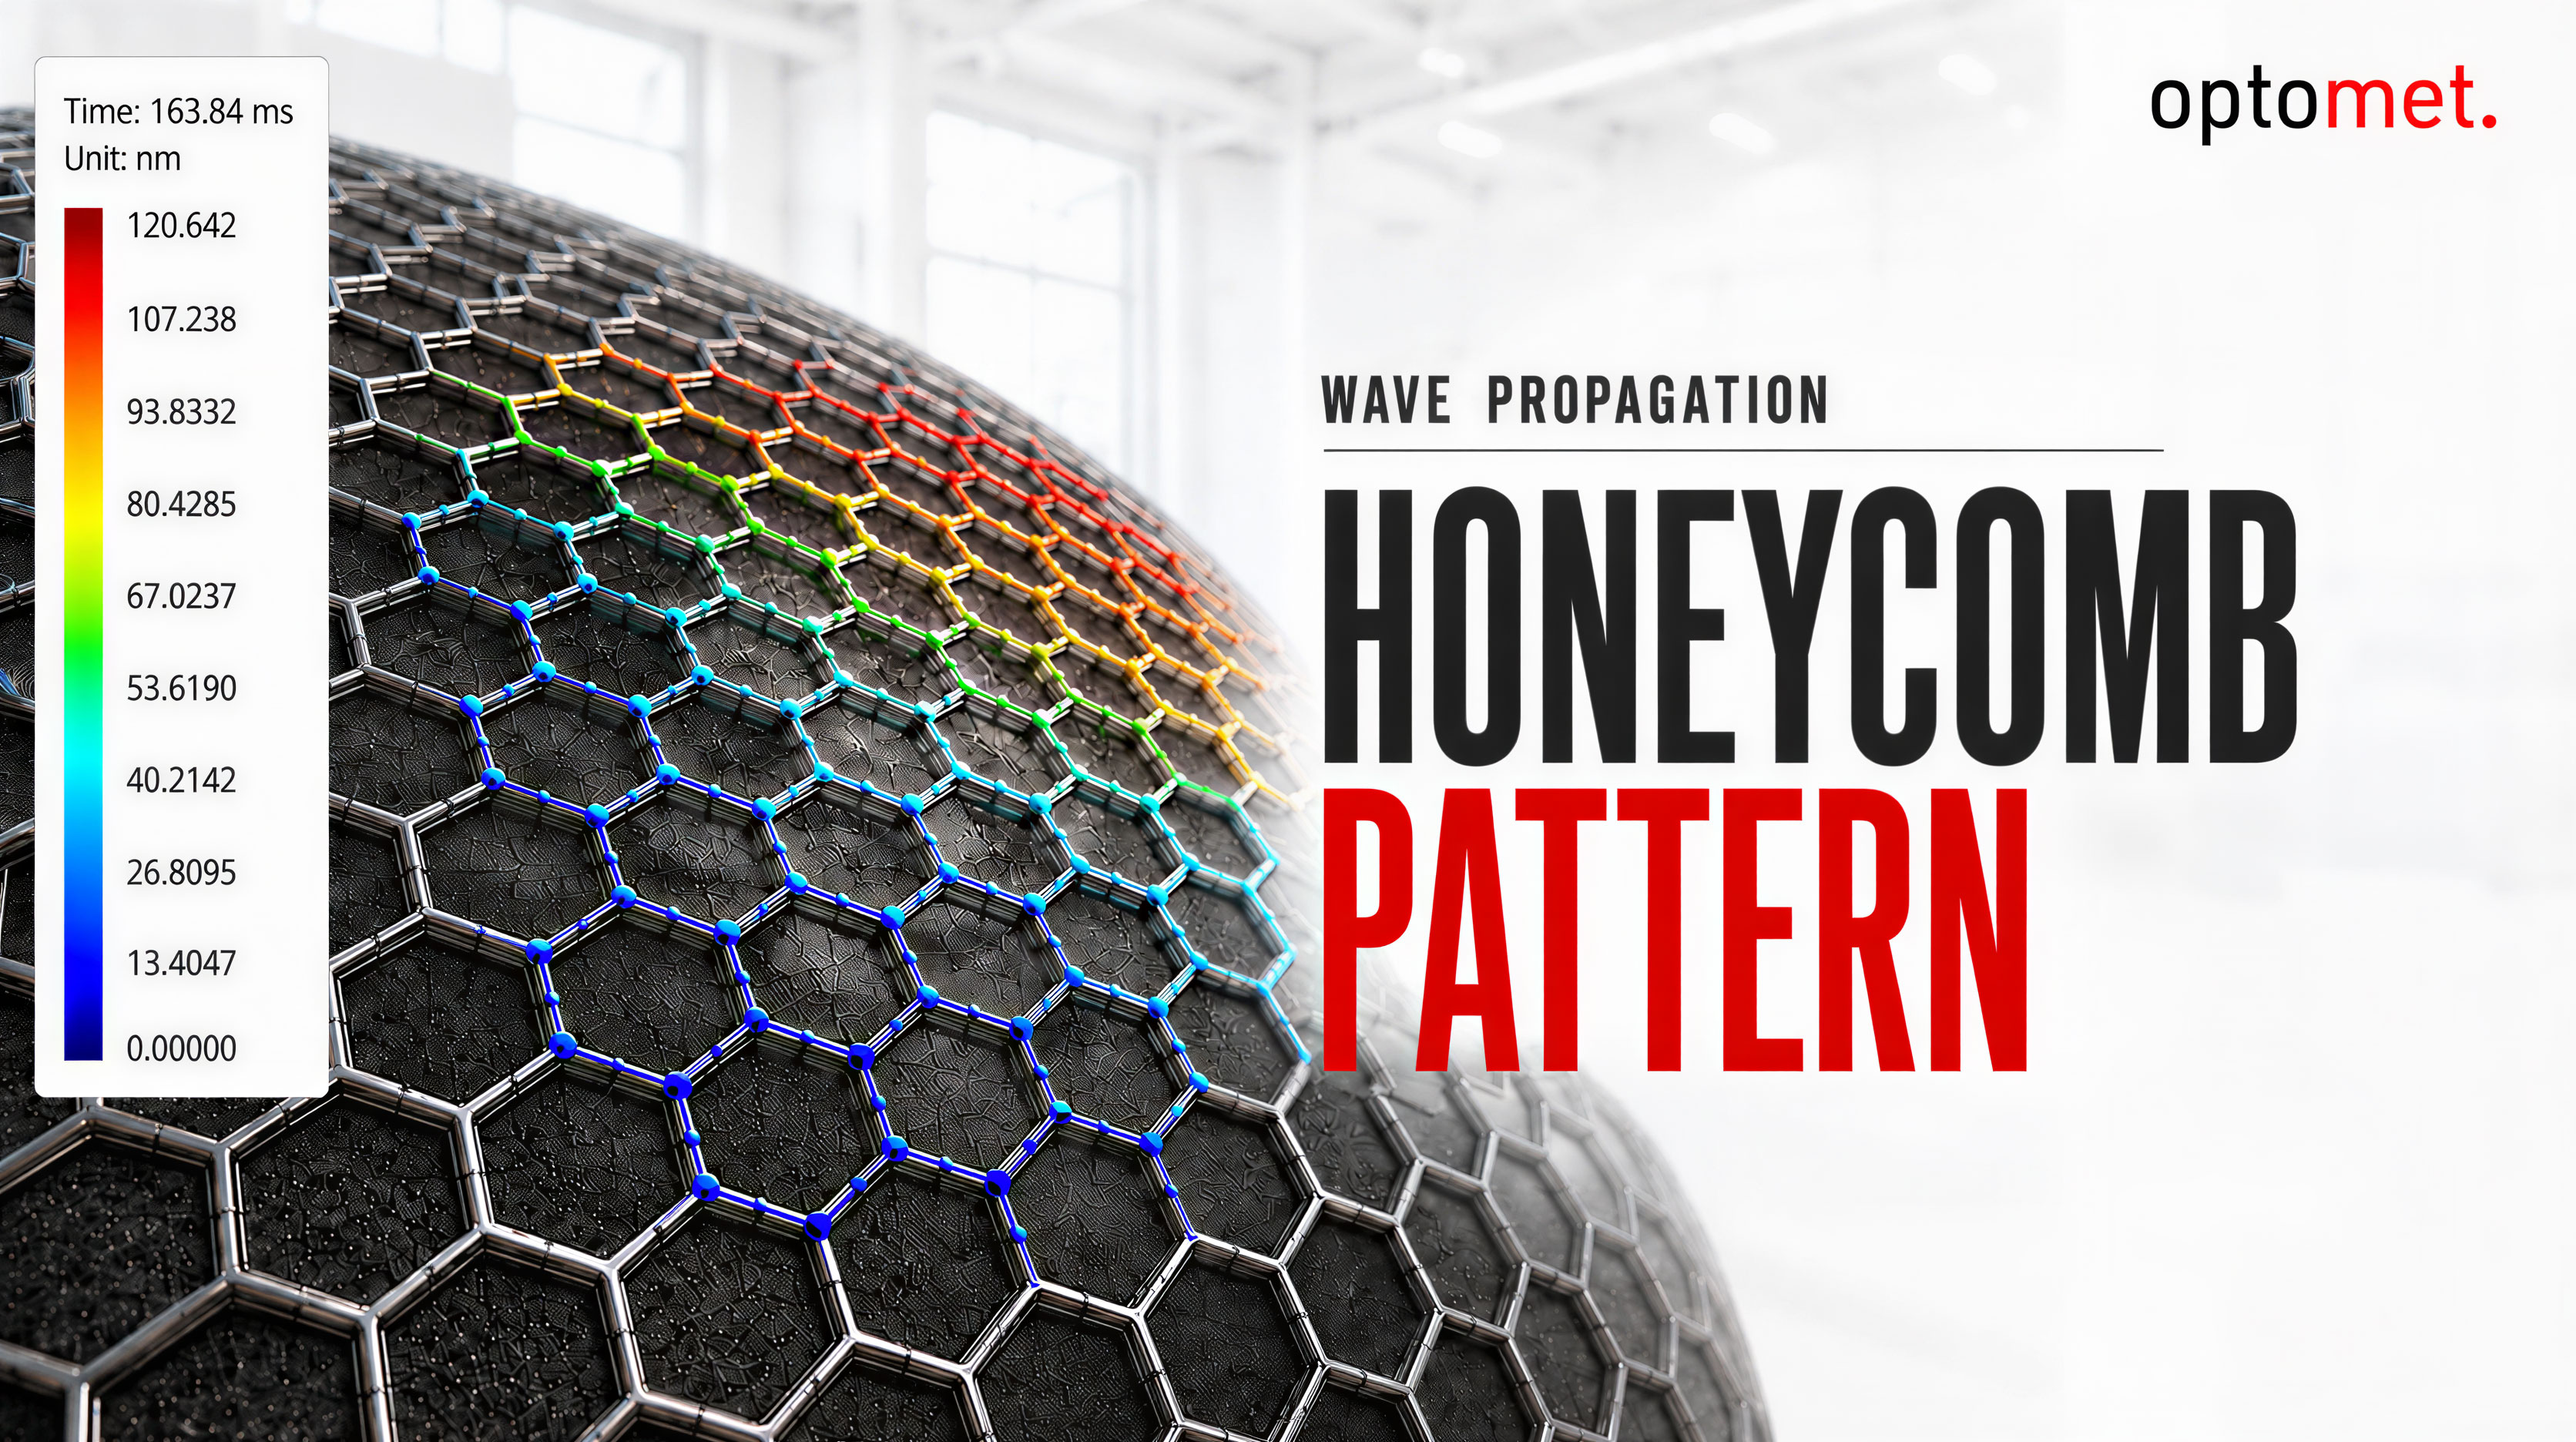
Time-domain view – angled perspective
Time-domain measurement of the honeycomb structure in an oblique view: From this perspective, the spatial propagation of the wave across the surface is particularly easy to see. [2020 | 0:11 min]
Open video page →