- Products
- Solutions
- Applications
- Knowledge
- Optomet
 SMART Scan+
 SMART 3D-Scan
 SMART Full Body
 SMART Single+
 SMART Multi-Fiber
 SMART 3D-Fiber
 SMART DAQ
 Software SMART Lab
 Scanning Vibrometer
 Vector-Series
 Vector-Micro-Optics
 Nova-Series
 Nova-Xtra
 Fiber-Series
 Fiber-Multiplex
 Fiber Micro Manipulator
 OptoSCAN
 OptoGUI
 Single-Point Vibrometers
 Scanning Vibrometers
 3D-Laser Vibrometers
 Acoustics & Ultrasonics
 Aerospace and aviation
 Automotive
 Biology & Medicine
 Brake noise
 Civil Engineering
 Electronics & Household Devices
 Materials Research
 Medical technology
 Tools & Machinery
 Turbine
 Wind tunnel testing
Optomet GmbH
Uhlandstraße 9
64297 Darmstadt
Mail:
sales(at)optomet.de
Phone: +49 6151 38432-0

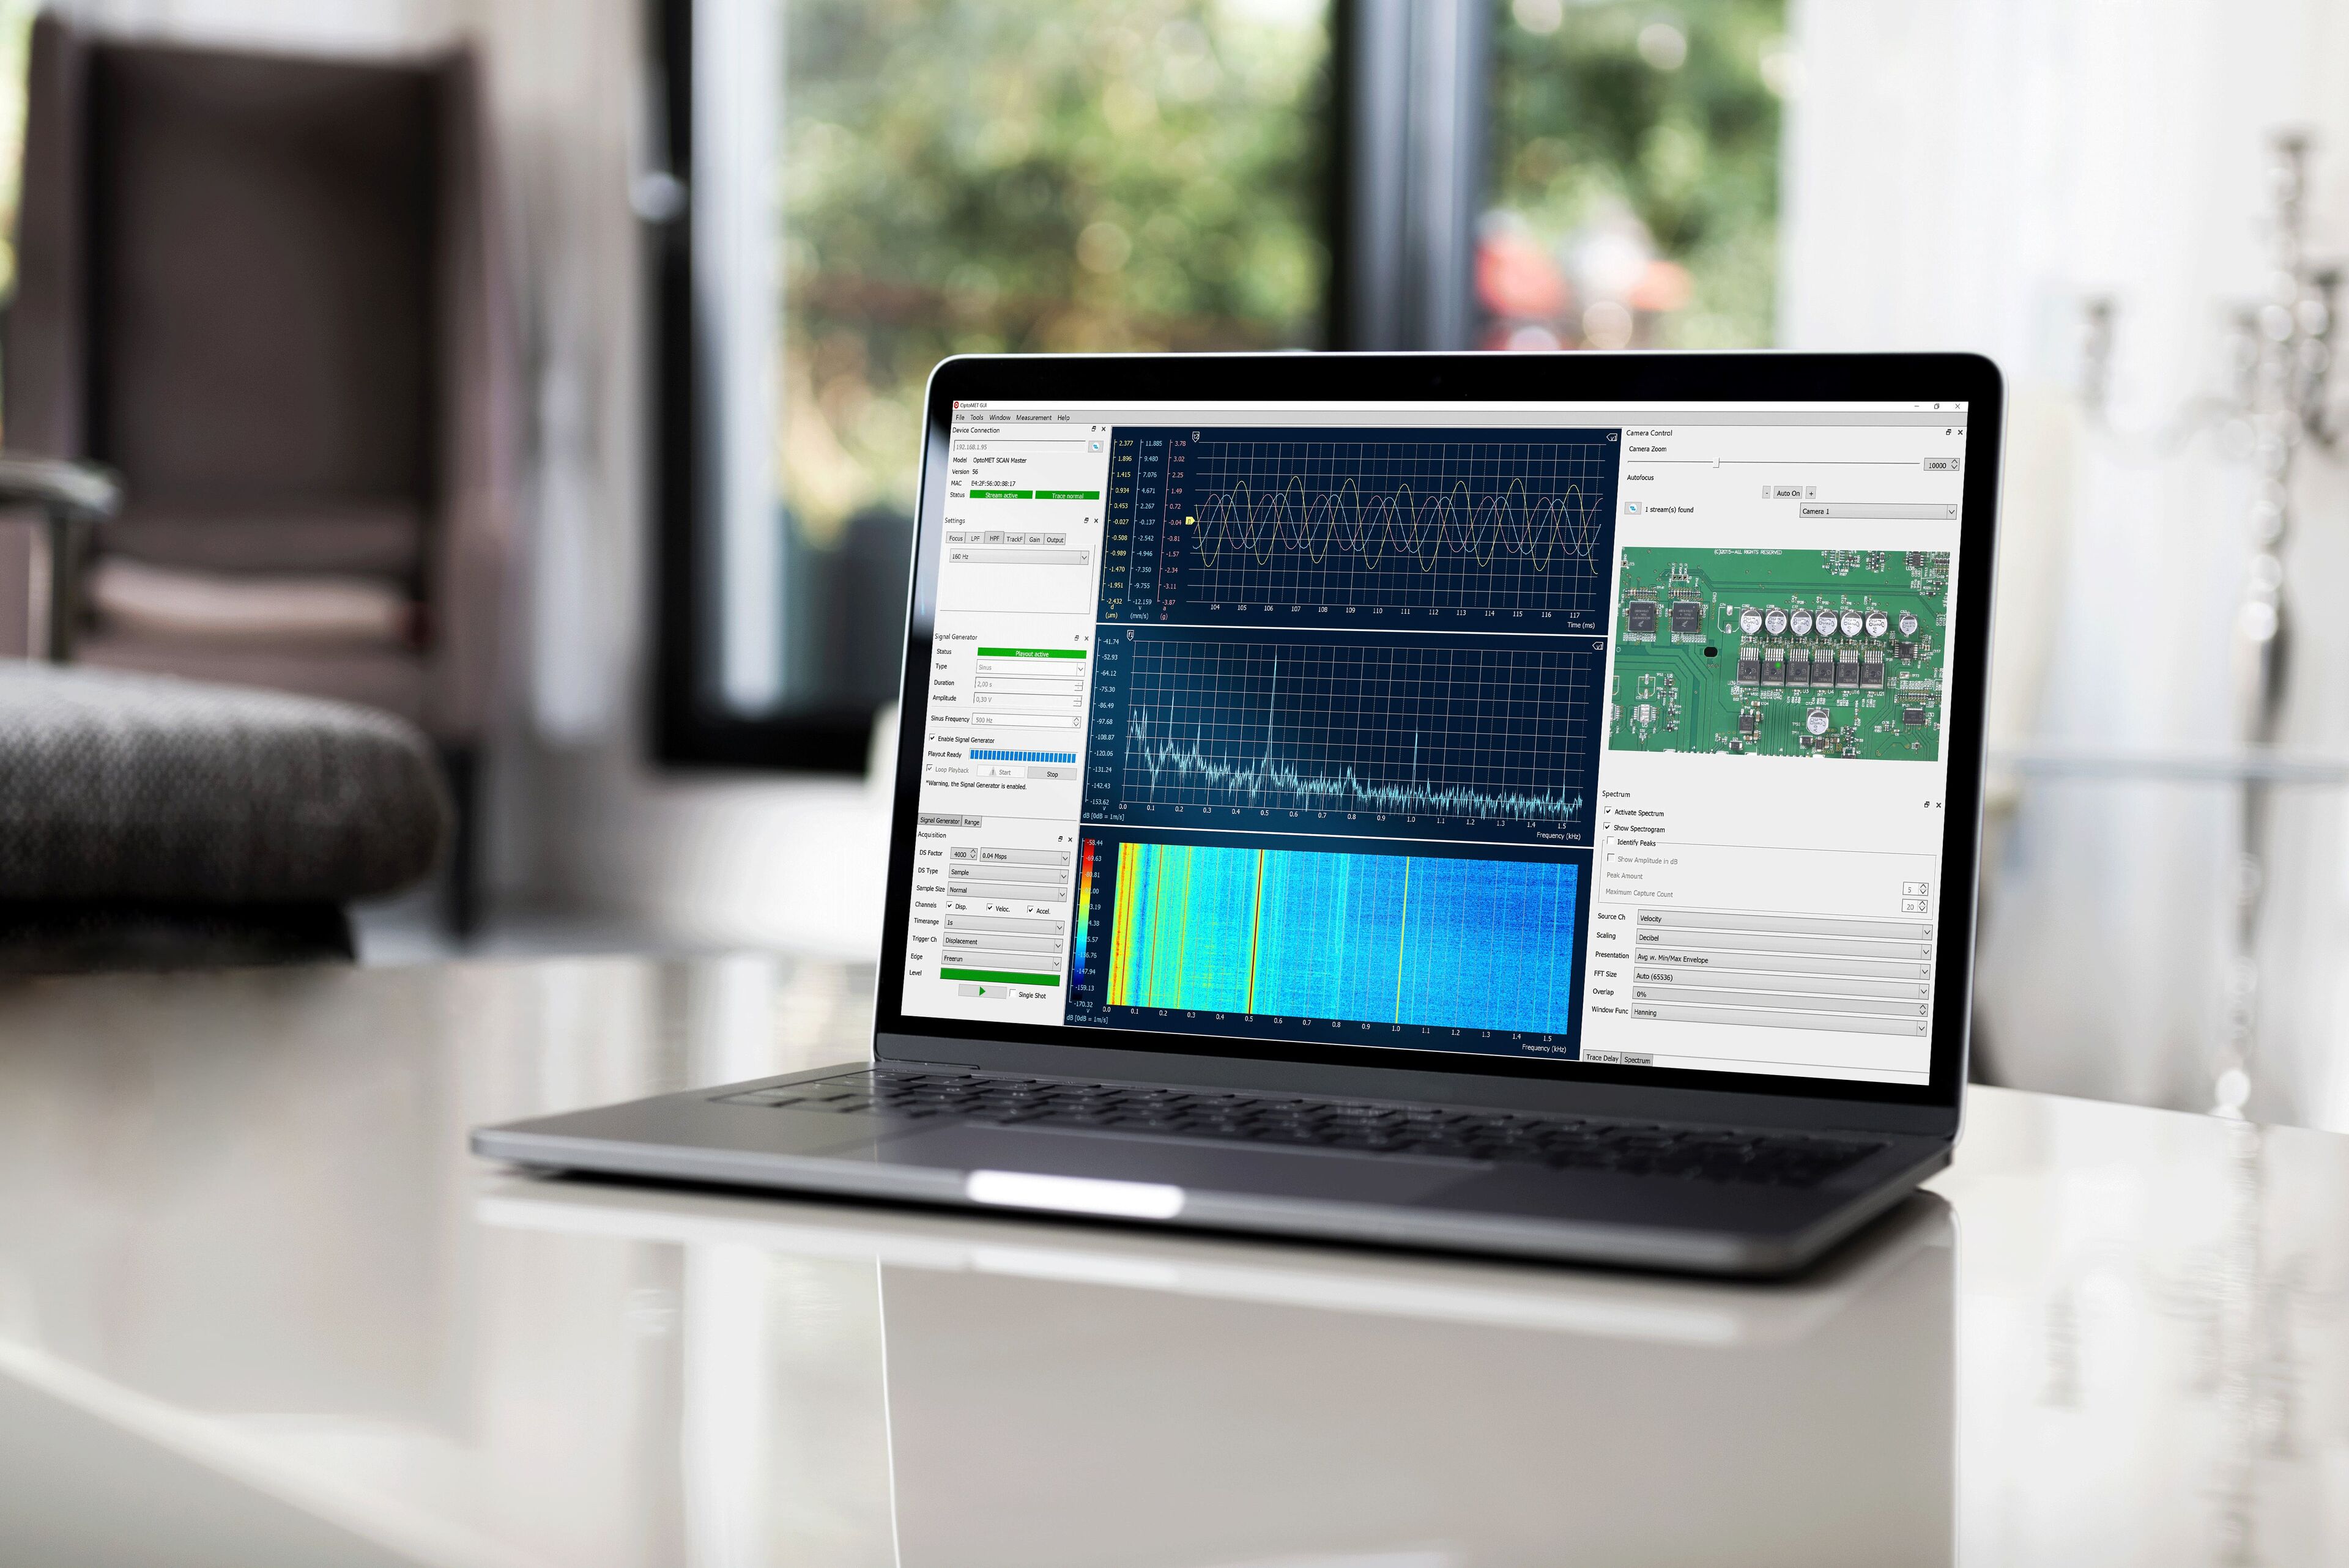
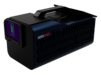
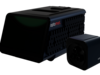
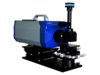
OptoGUI
Software for Single-Point Vibrometers
OptoGUI is the measurement, analysis and remote control software for the Optomet single-point vibrometer and complements it to form a complete system from a single source with a continuous digital signal path.
-min")
Efficiency and precision with OptoGUI
OptoGUI is the measurement, analysis and remote control software for the Optomet single-point vibrometer and complements it to form a complete system from a single source with a continuous digital signal path.
Vibrometer remote control
The vibrometer settings are read out and set by the software. Optional components such as the signal generator can also be controlled.
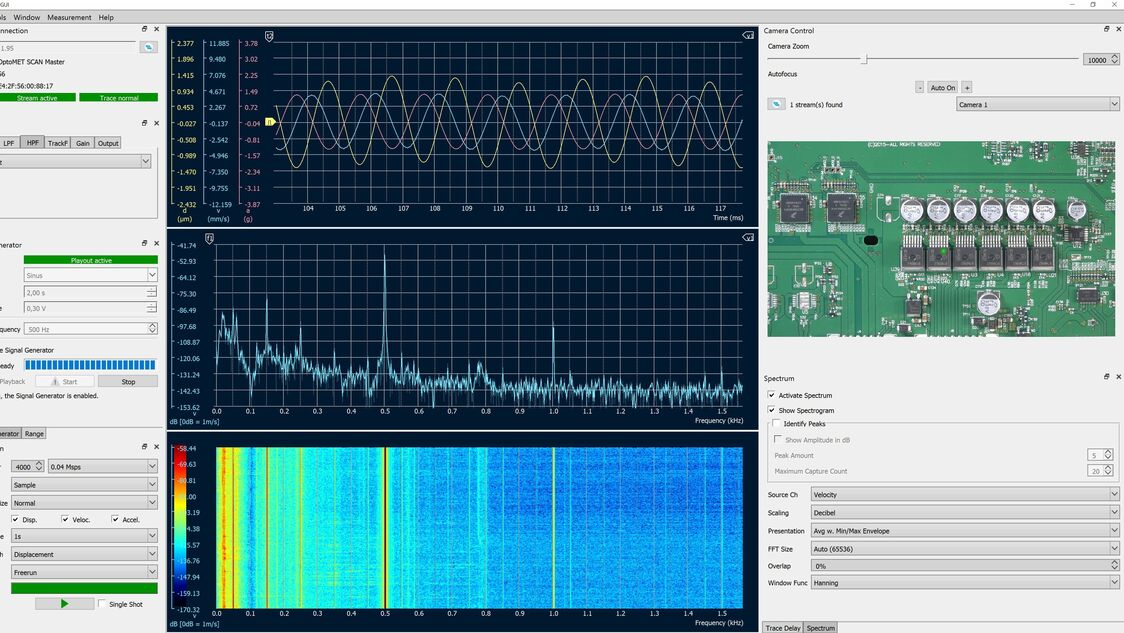
Data acquisition
The software receives the measurement data via the Gigabit Ethernet interface with up to 32-bit resolution and displays deflection, speed and acceleration over time. Measurements can be triggered with the recorded data or an external signal.
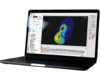
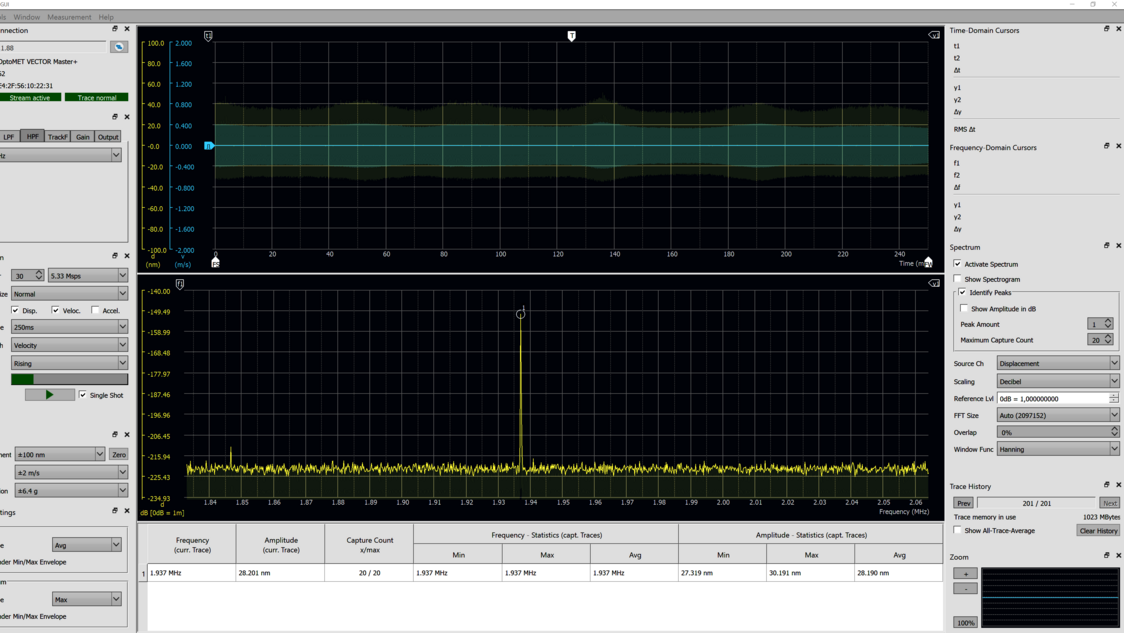
Display and evaluation
Cursor and zoom functions make it easier to analyze the measurement data. The frequency display shows the spectrum of the measurement with up to 8 million lines; frequency peaks can be automatically searched for and identified. The frequency content over time is displayed as a spectrogram.
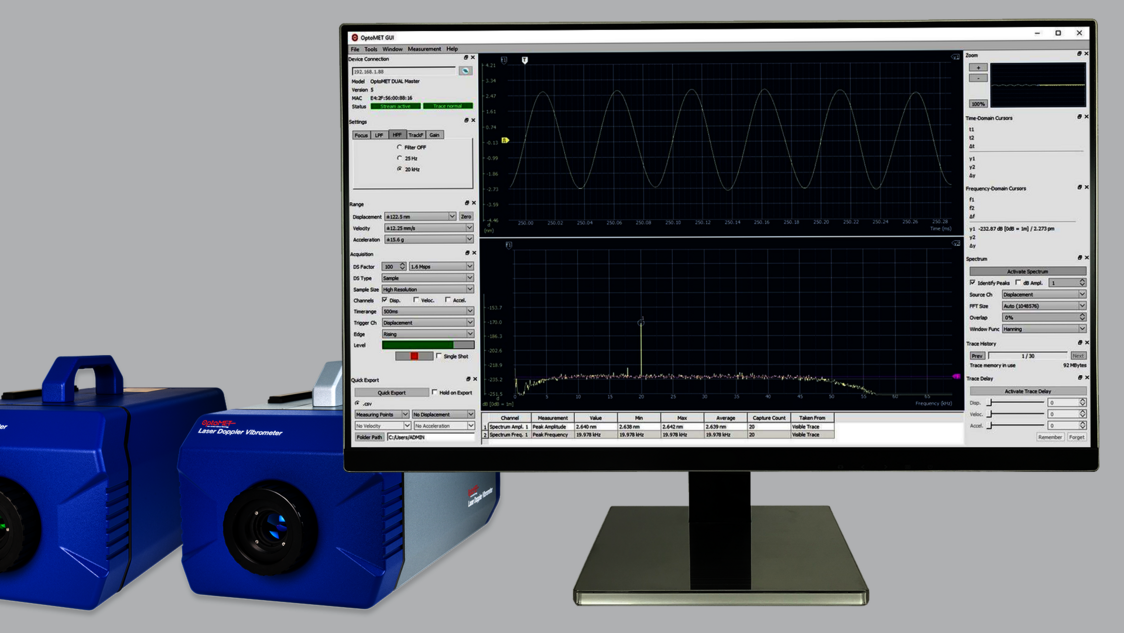
Data export
The measurement data can be saved in numerous standard file formats as text or binary data for further processing. Output as an audio file is also possible. The analog signal is output in parallel with the digital transmission.
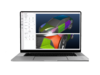
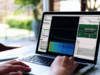
Intuitive and high-performance
The software is intuitive and easy to use, even for first-time users. OptoGUI runs efficiently and platform-independently on standard PC hardware, requiring neither special drivers nor installation.
Storage and data exchange
OptoSCAN projects are clearly stored and can be read in again along with all settings for future analysis. Extensive exporting options are available for further processing of the measurement data outside OptoSCAN. Documented and open file formats enable easy exchange with programs from third-party providers, for example for modal analysis or with standard software such as MATLAB®.
Intuitive operation
Using OptoSCAN is very easy. The structure of the user interface is based on the typical workflow of a scanning vibrometer measurement: definition of the measurement project, selection of the channels and measurement ranges, definition of the geometry and measurement points, selection of the acquisition parameters and finally presentation and analysis of the measurement results. New users are guided intuitively through the measurement process, and experienced users can enjoy comprehensive functionality.
Further information
Details of the functions of the vibrometer and the OptoSCAN software can be found in the data sheet of the laser scanning vibrometer.
CallNow
Europe: 9:00am - 5:00pm (UTC+1)
Americas: 3:00am - 12:00pm (UTC-5)
Asia: 3:00pm - 0:00am (UTC+8)
CallBack